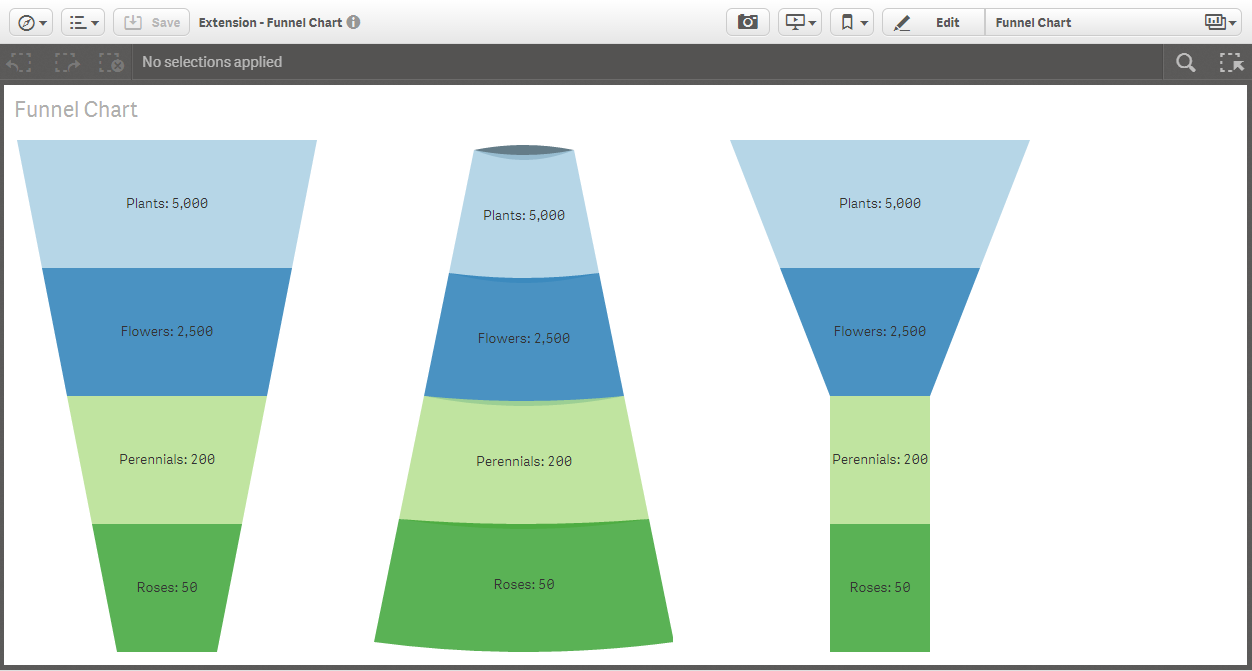
Funnel Chart for Qlik Sense.
(Table of contents generated by [verb])
- Download the latest version
- Qlik Sense Desktop
- To install, copy all files in the .zip file to folder "C:\Users[%Username%]\Documents\Qlik\Sense\Extensions\Funnelchart"
- Qlik Sense Server
- See instructions how to import an extension on Qlik Sense Server
The funnel chart visualization extension only requires
- one dimension (the label)
- one measure
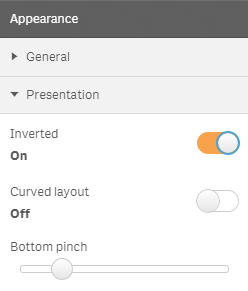
There are some other configuration options available:
- Inverting the funnel
- Forcing a curved layout
- Defining the the bottom pinch
Pull requests and stars are always welcome. For bugs and feature requests, please create an issue. The process for contributing is outlined below:
- Create a fork of the project
- Work on whatever bug or feature you wish
- Create a pull request (PR)
I cannot guarantee that I will merge all PRs but I will evaluate them all.
There are some features I definitely like to add. More suggestions are welcome!
- Reflect number formatting of the property panel in the chart
- Modify color scheme
- Make selections possible
Some related projects (Qlik Sense Visualization Extensions) I have recently created:
- qliksense-extension-tutorial: Comprehensive tutorial to start developing Qlik Sense Extensions. | homepage
- sense-extension-recipes: Recipes on working with Qlik Sense Visualization Extensions. | homepage
- sense-media-box: Include web pages, videos, images and much more into your Qlik Sense app. | homepage
- sense-on-off-switch: Set a variable in Qlik Sense to true/false using an on-off switch. | homepage
- sense-themable-kpi-tile: KPI Tile for Qlik Sense with the ability to use themes or to customize background… more | homepage
Stefan Walther
Released under the MIT license.
This file was generated by verb-cli on May 13, 2016.

