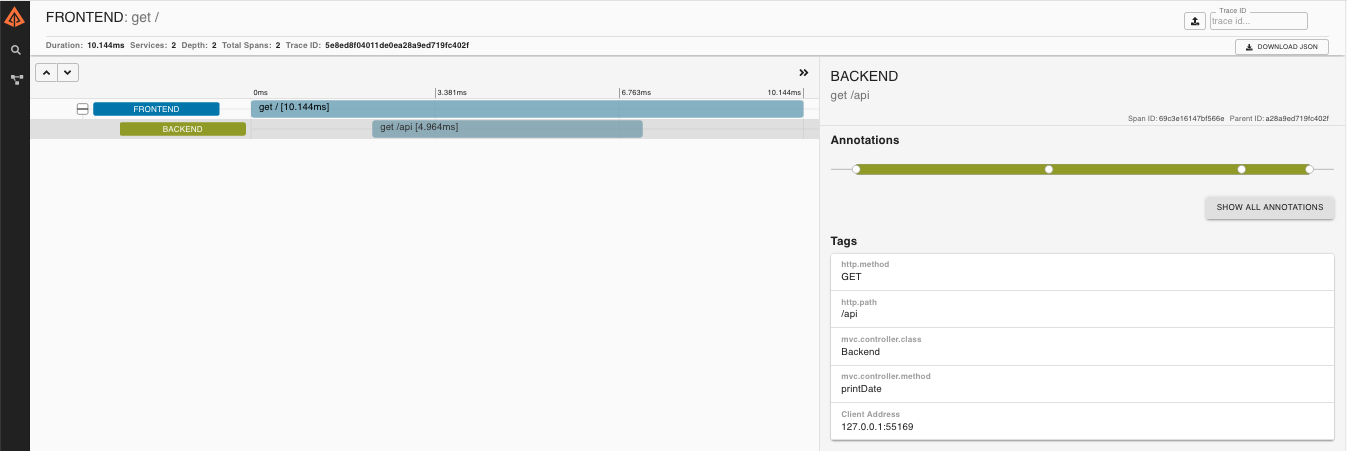
There are a few samples with slightly different features. You can run all of them from an IDE via the main method, or on the command line with mvn spring-boot:run. They all log trace and span data on the console by default. Here’s a list:
-
spring-cloud-sleuth-sample: vanilla (no zipkin) web app that calls back to itself on various endpoints ("/", "/call", "/async") -
spring-cloud-sleuth-sample-zipkin: same as vanilla sample but with zipkin (setsample.zipkin.enabled=trueif you have a collector running) -
spring-cloud-sleuth-sample-stream: same as vanilla sample, but exports span data to RabbitMQ using Spring Cloud Stream -
spring-cloud-sleuth-sample-stream-zipkin: a consumer for the span data on RabbitMQ that pushes it into a Zipkin span store, so it can be queried and visualized using the embedded Zipkin UI. -
spring-cloud-sleuth-sample-messaging: a Spring Integration application with two HTTP endpoints ("/" and "/xform") -
spring-cloud-sleuth-sample-ribbon: two endpoints ("/" and "/call") that make calls to the "zipkin" sample via Ribbon. Also has `@EnableZUulProxy" so if the other samples are running they are proxied at "/messaging", "/zipkin", "/vanilla" (see "/routes" for a list).
The Ribbon sample makes an interesting demo or playground for learning about zipkin. In the screenshot below you can see a trace with 3 spans - it starts in the "testSleuthRibbon" app and crosses to "testSleuthMessaging" for the next 2 spans.
-
Optionally run the Zipkin Server, e.g. via docker compose (there’s a
docker-compose.ymlin Spring Cloud Sleuth, or in Docker Zipkin -
Run the zipkin sample application (set
sample.zipkin.enabled=falseif you have no Zipkin running). If you are using a VM to run docker you might need to tunnel port 9411 to localhost, or change thespring.zipkin.baseUrl. -
Hit
http://localhost:3380,http://localhost:3380/call,http://localhost:3380/asyncfor some interesting sample traces (the app callas back to itself). -
Go to
http://localhost:9411for Zipkin’s UI (if you are using boot2docker the host will be different)
|
Note
|
You can see the zipkin spans without the UI (in logs) if you run the sample with sample.zipkin.enabled=false.
|
The fact that the first trace in says "testSleuthMessaging" seems to be a bug in the UI (it has some annotations from that service, but it originates in the "testSleuthRibbon" service).
Instead of POSTing trace data directly to a Zipkin server, you can export them over Spring Cloud Stream.
-
Run the RabbitMQ middleware for Zipkin (you can use
docker-compose.yml). -
Build the Zipkin Stream sample with Maven and run it.
-
Run the
spring-cloud-sleuth-sample-streamapp and interact with it in a browser, just like the vanilla sample. If you are using a VM to run docker you might need to tunnel port 5672 to localhost, or change thespring.rabbbitmq.host. -
Go to
http://localhost:9411for Zipkin’s UI
The UI should look more or less like this:

