The LOCKSS dashboard is based on Grafana, Loki and Prometheus.
It provides full observability of the preservation network status by combining :
- data collected from LOCKSS boxes using the DaemonStatusService API
- metrics collected from the servers
- log files collected from the complete software stack
Based on the lockss.xml property file of your network, this software automatically deploy a Grafana instance and dashboards for each box in the network and for each publisher.
The LOCKSS dashboard home screen provides a global view of the available dashboards:
- A global network status dashboards
- A summary of active alerts
- Specific dashboards per box
- Specific dashboards per publisher
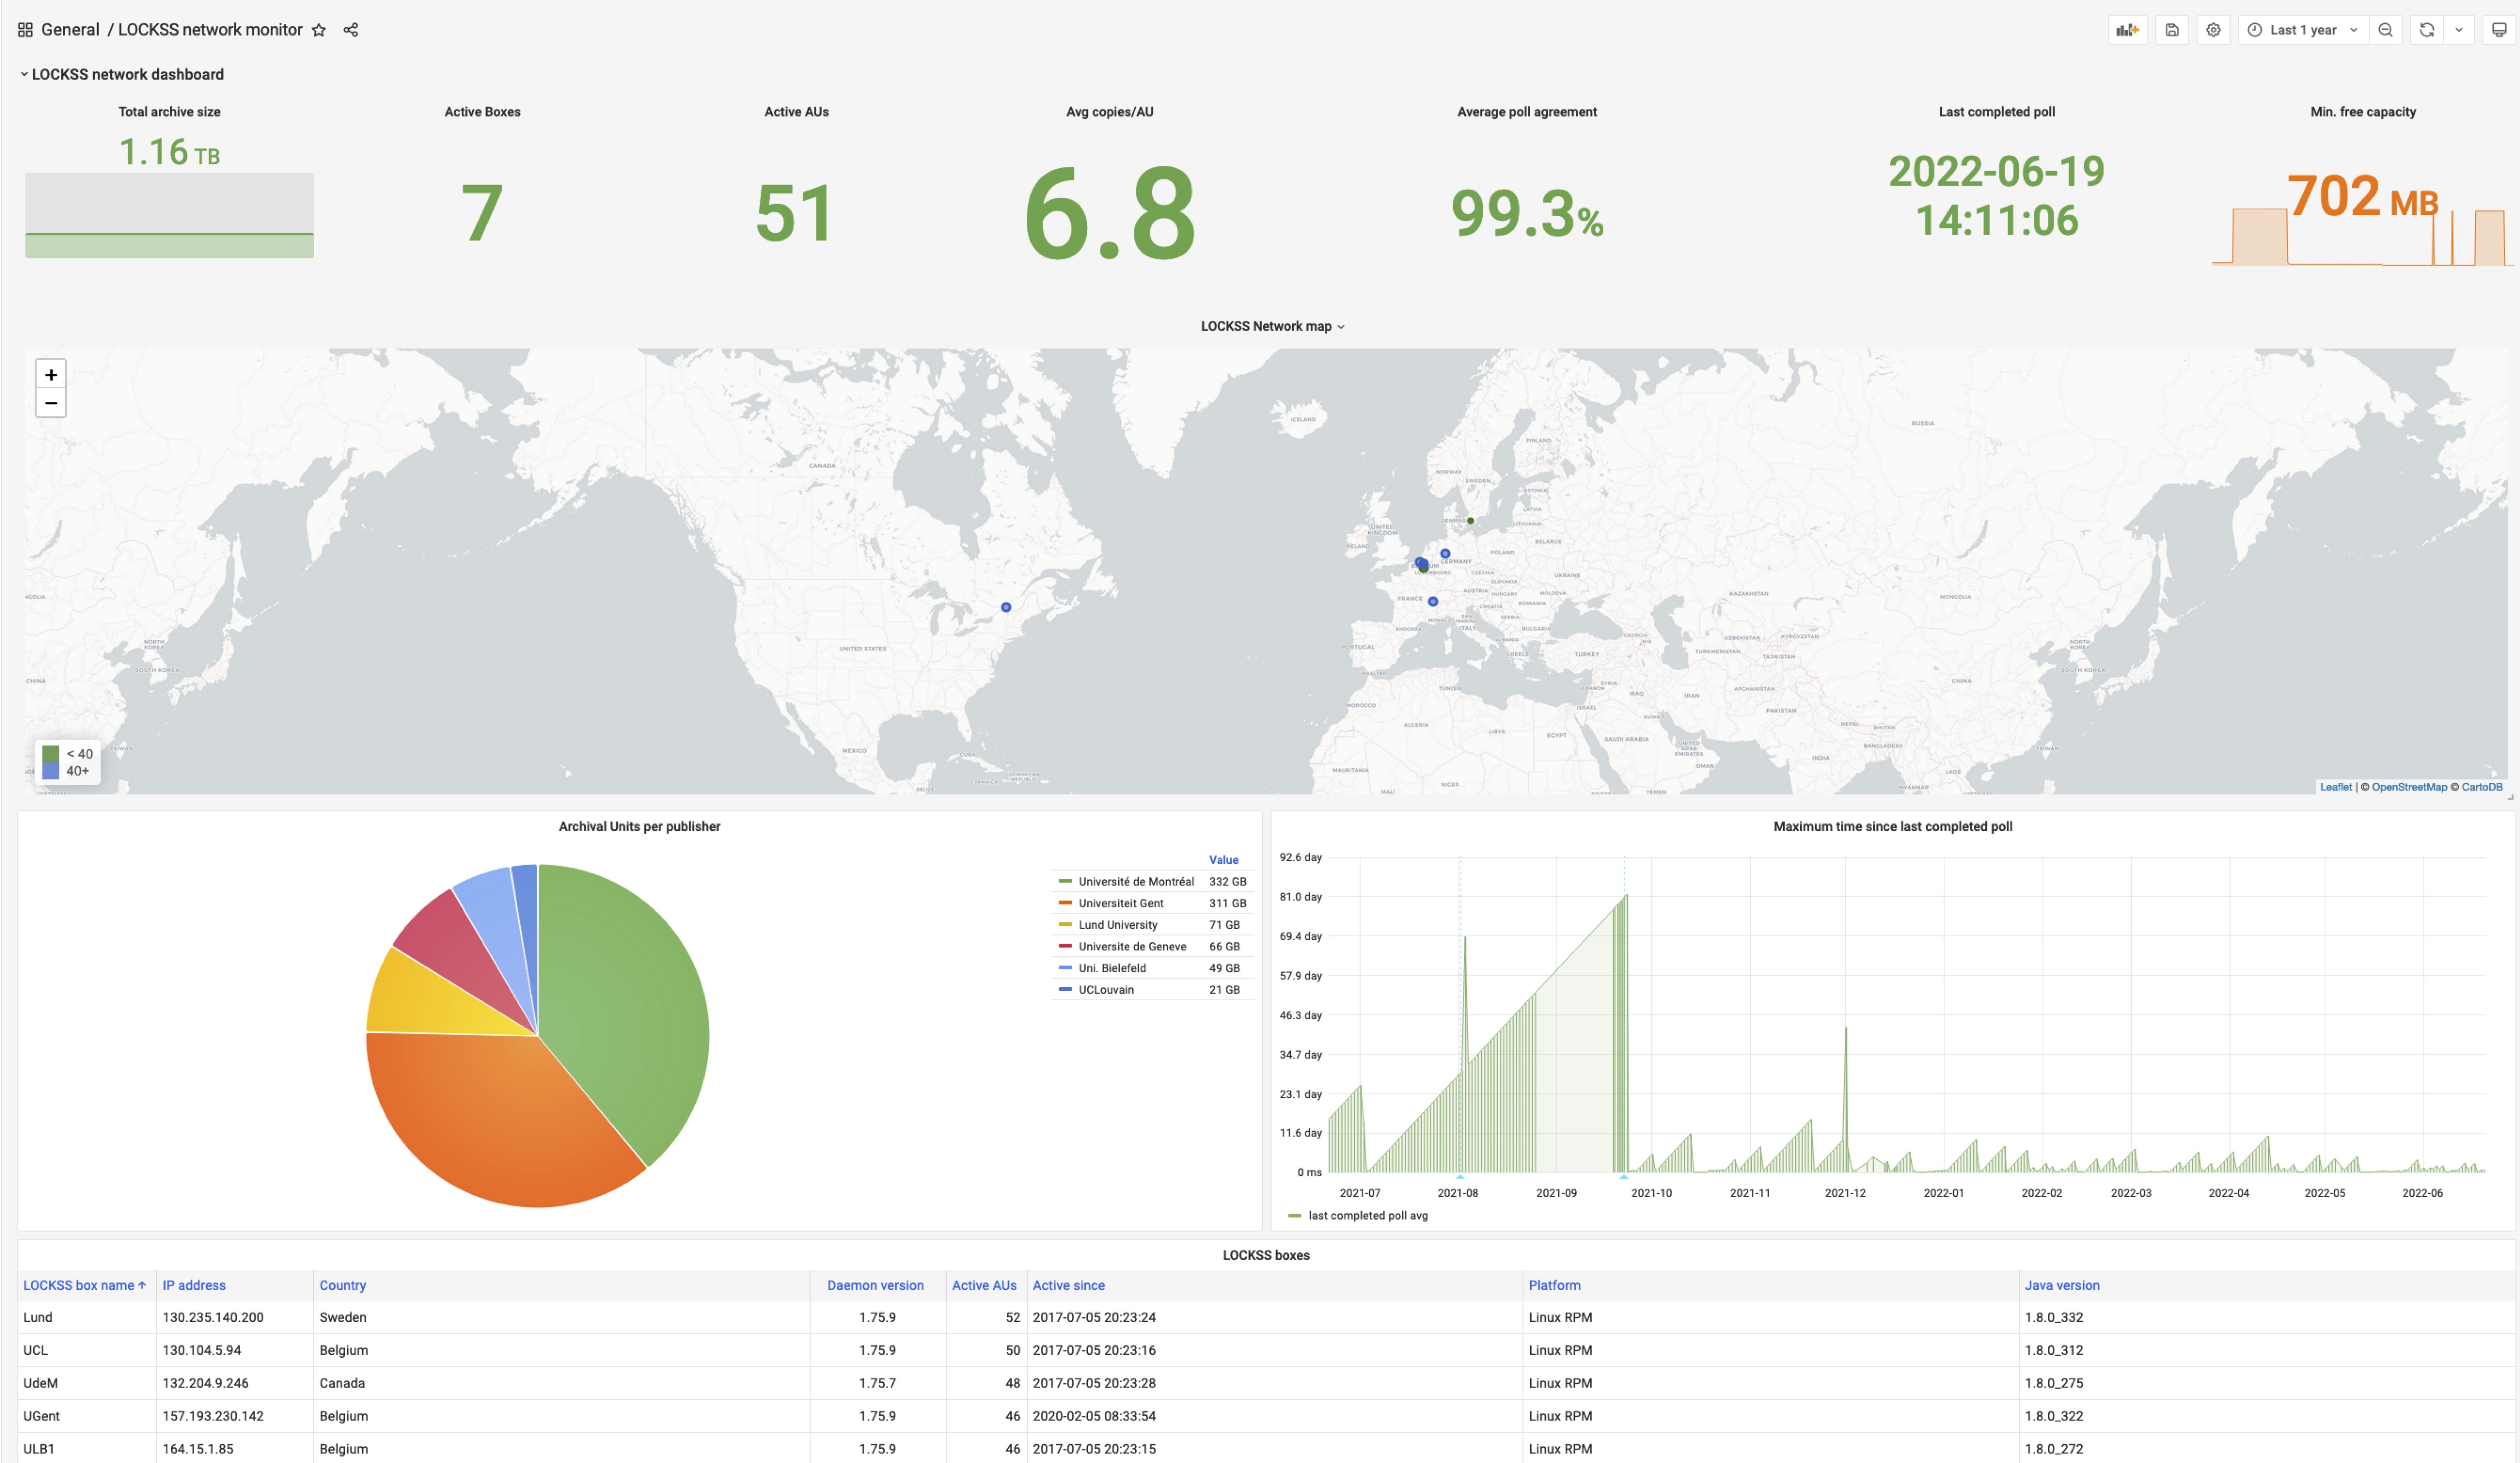
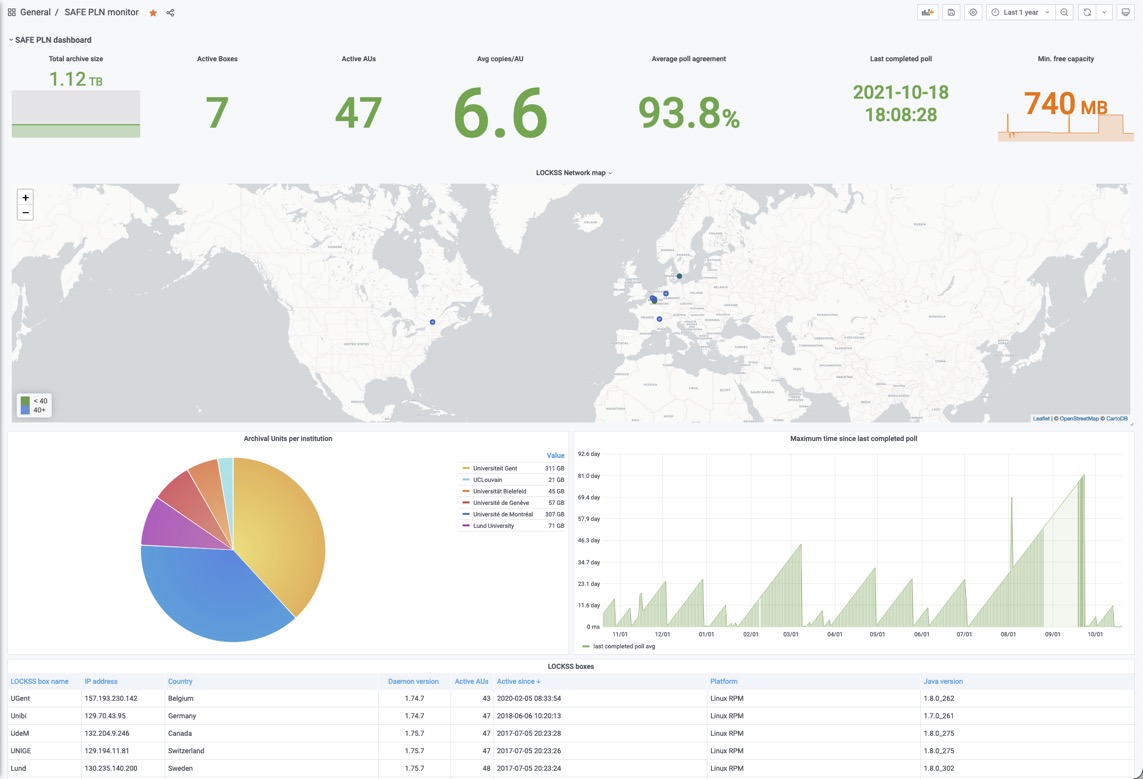
The global status dashboard allows administrators to ensure the proper functioning of the network and quickly identify a problem.
The top banner provides concise information on:
- the total archive size
- the number of active LOCKSS boxes
- the number of active Archival Units preserved in the network
- the average number of verified copies in the network per Archival Unit
- the average poll agreement in the network
- the time elapsed since the last poll has been completed in the network
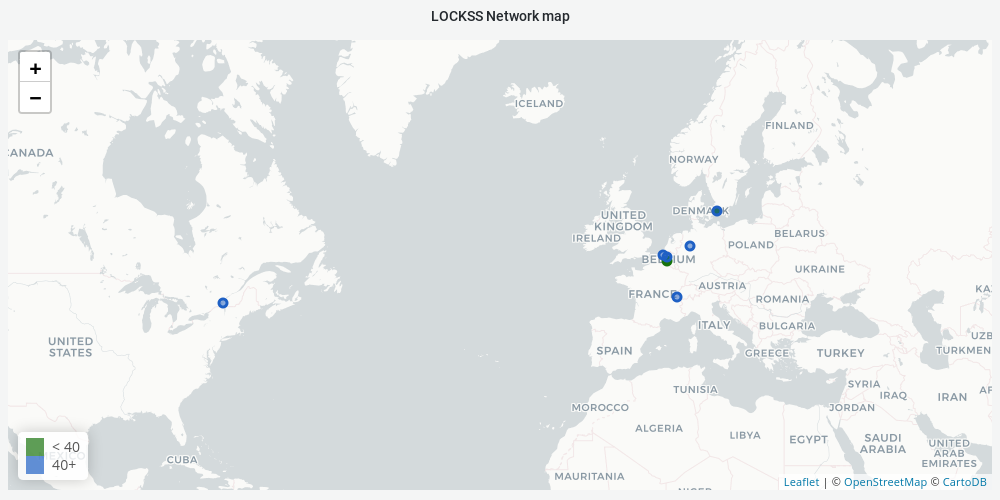
The dashboard also provides a map of the network showing the active LOCKSS boxes location and the number of active Archival Units they contain:
As well as the distribution of archival units per publisher:
And details on the LOCKSS box settings :
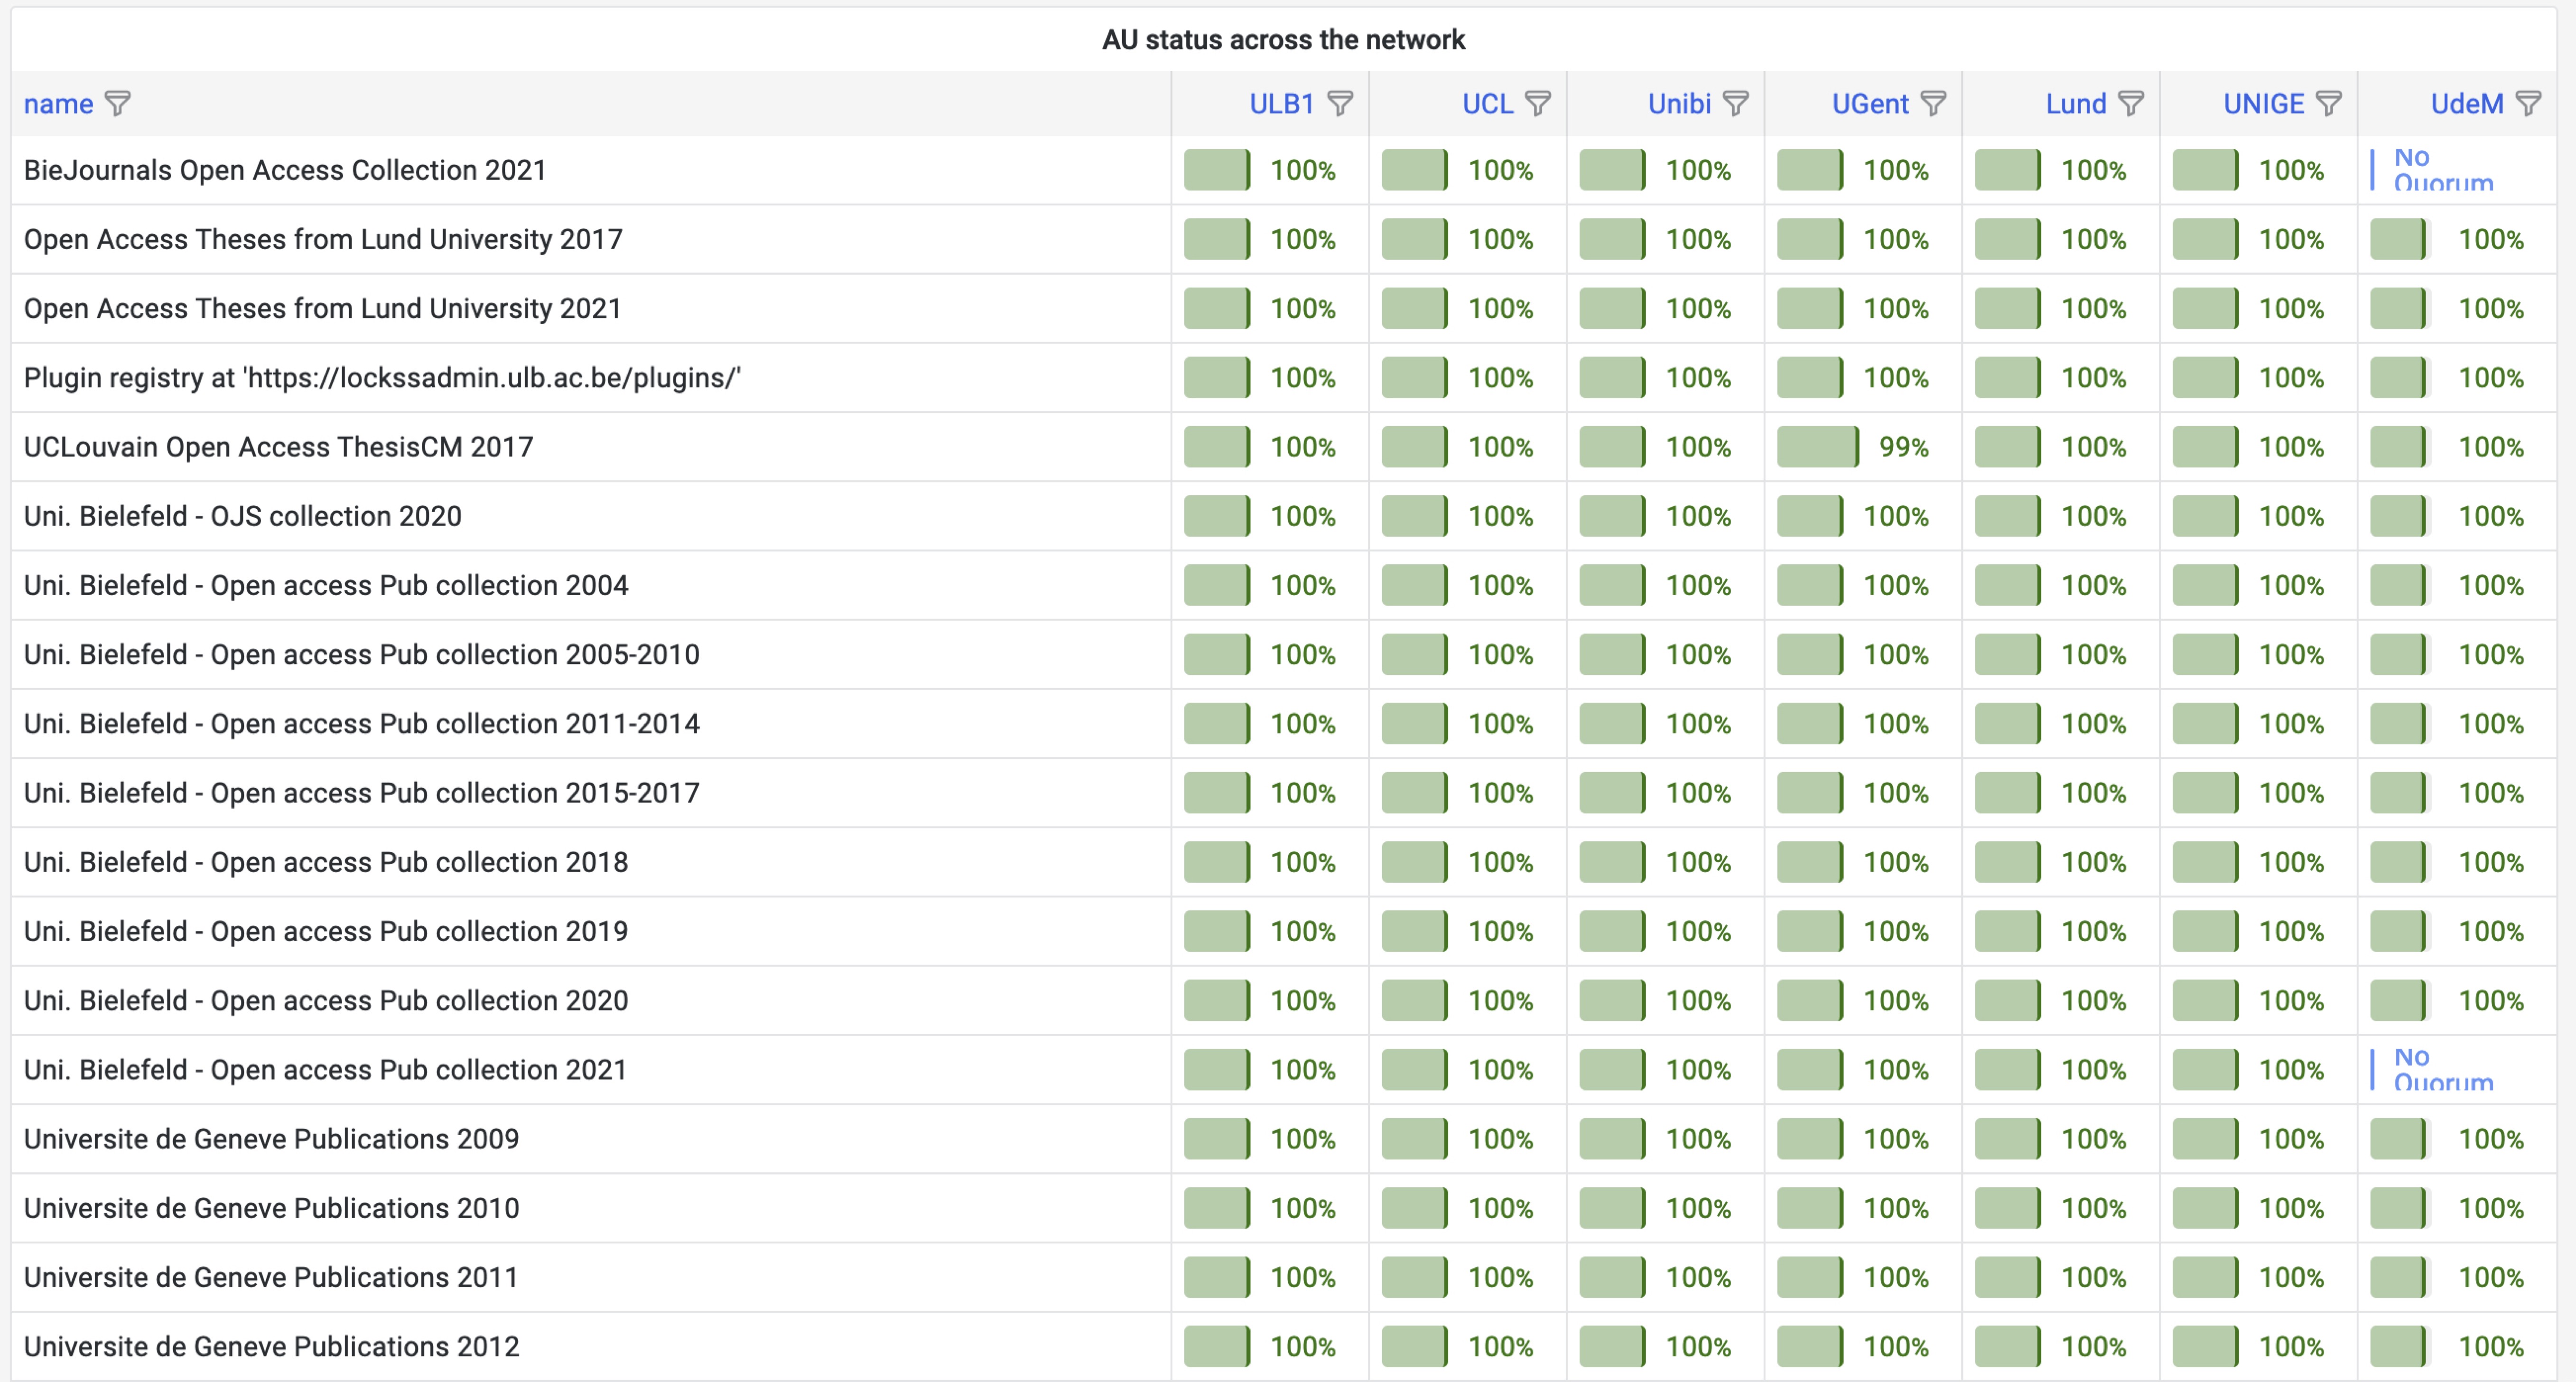
Finally, a very useful feature is the matrix detailing the status of each AU across the network:
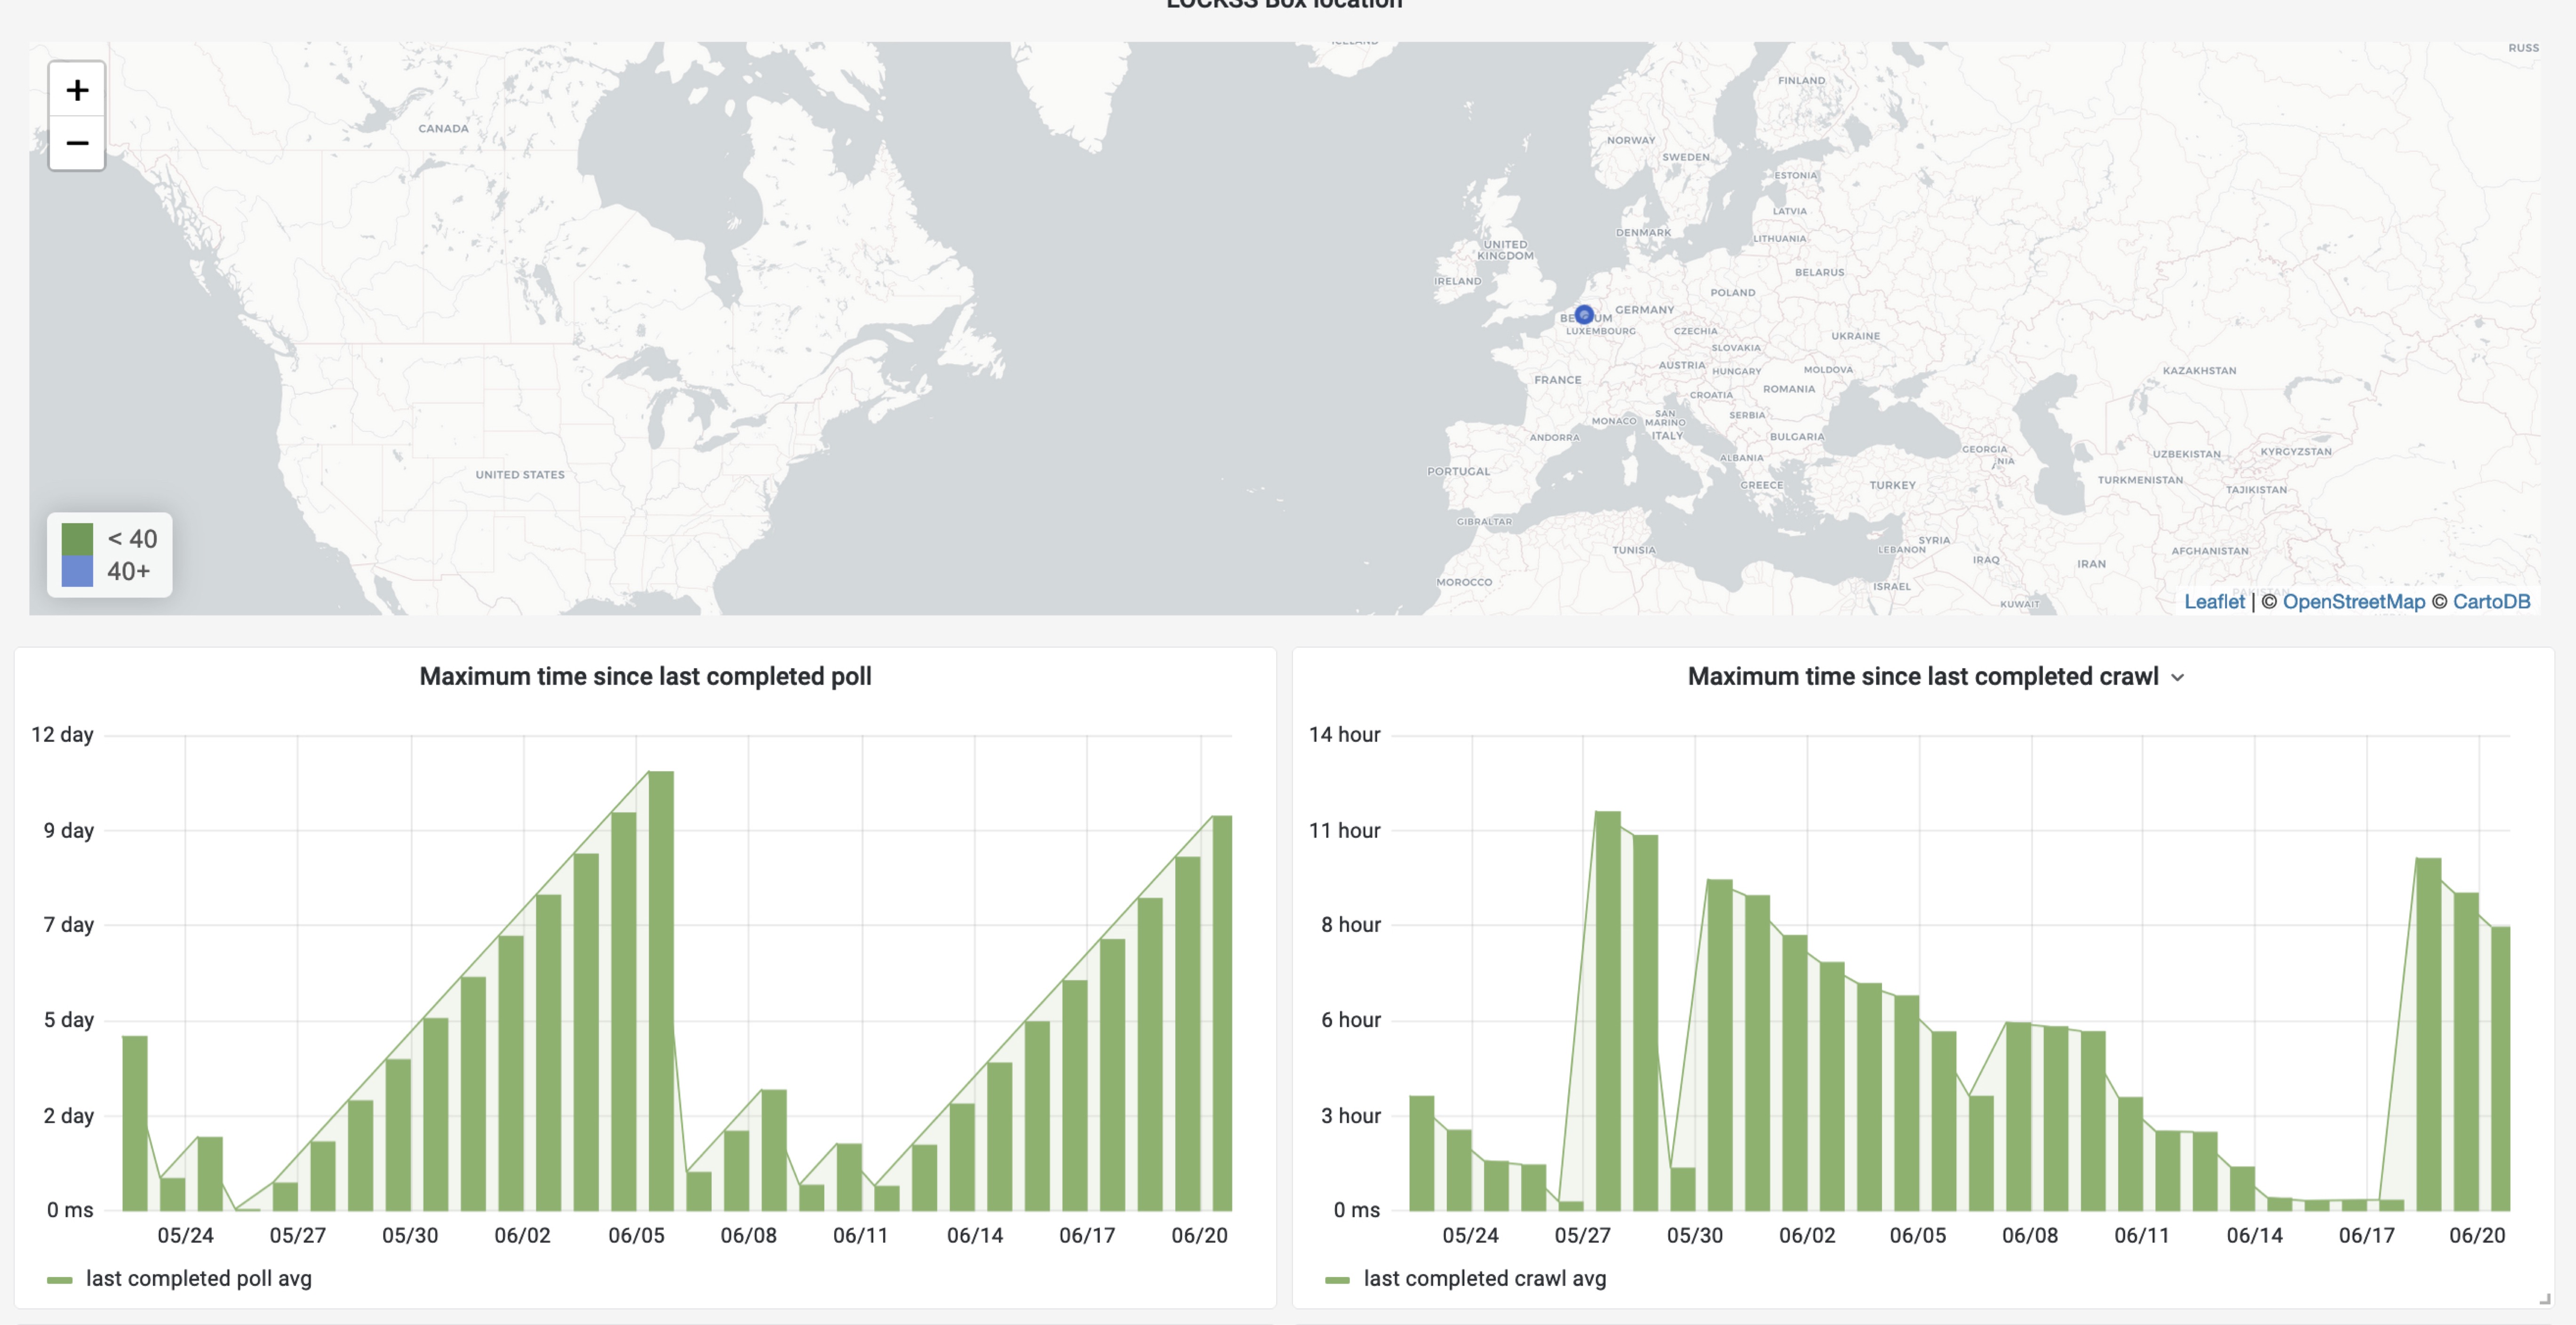
Each LOCKSS box in the network gets its own specific dashboard providing detailed status information:
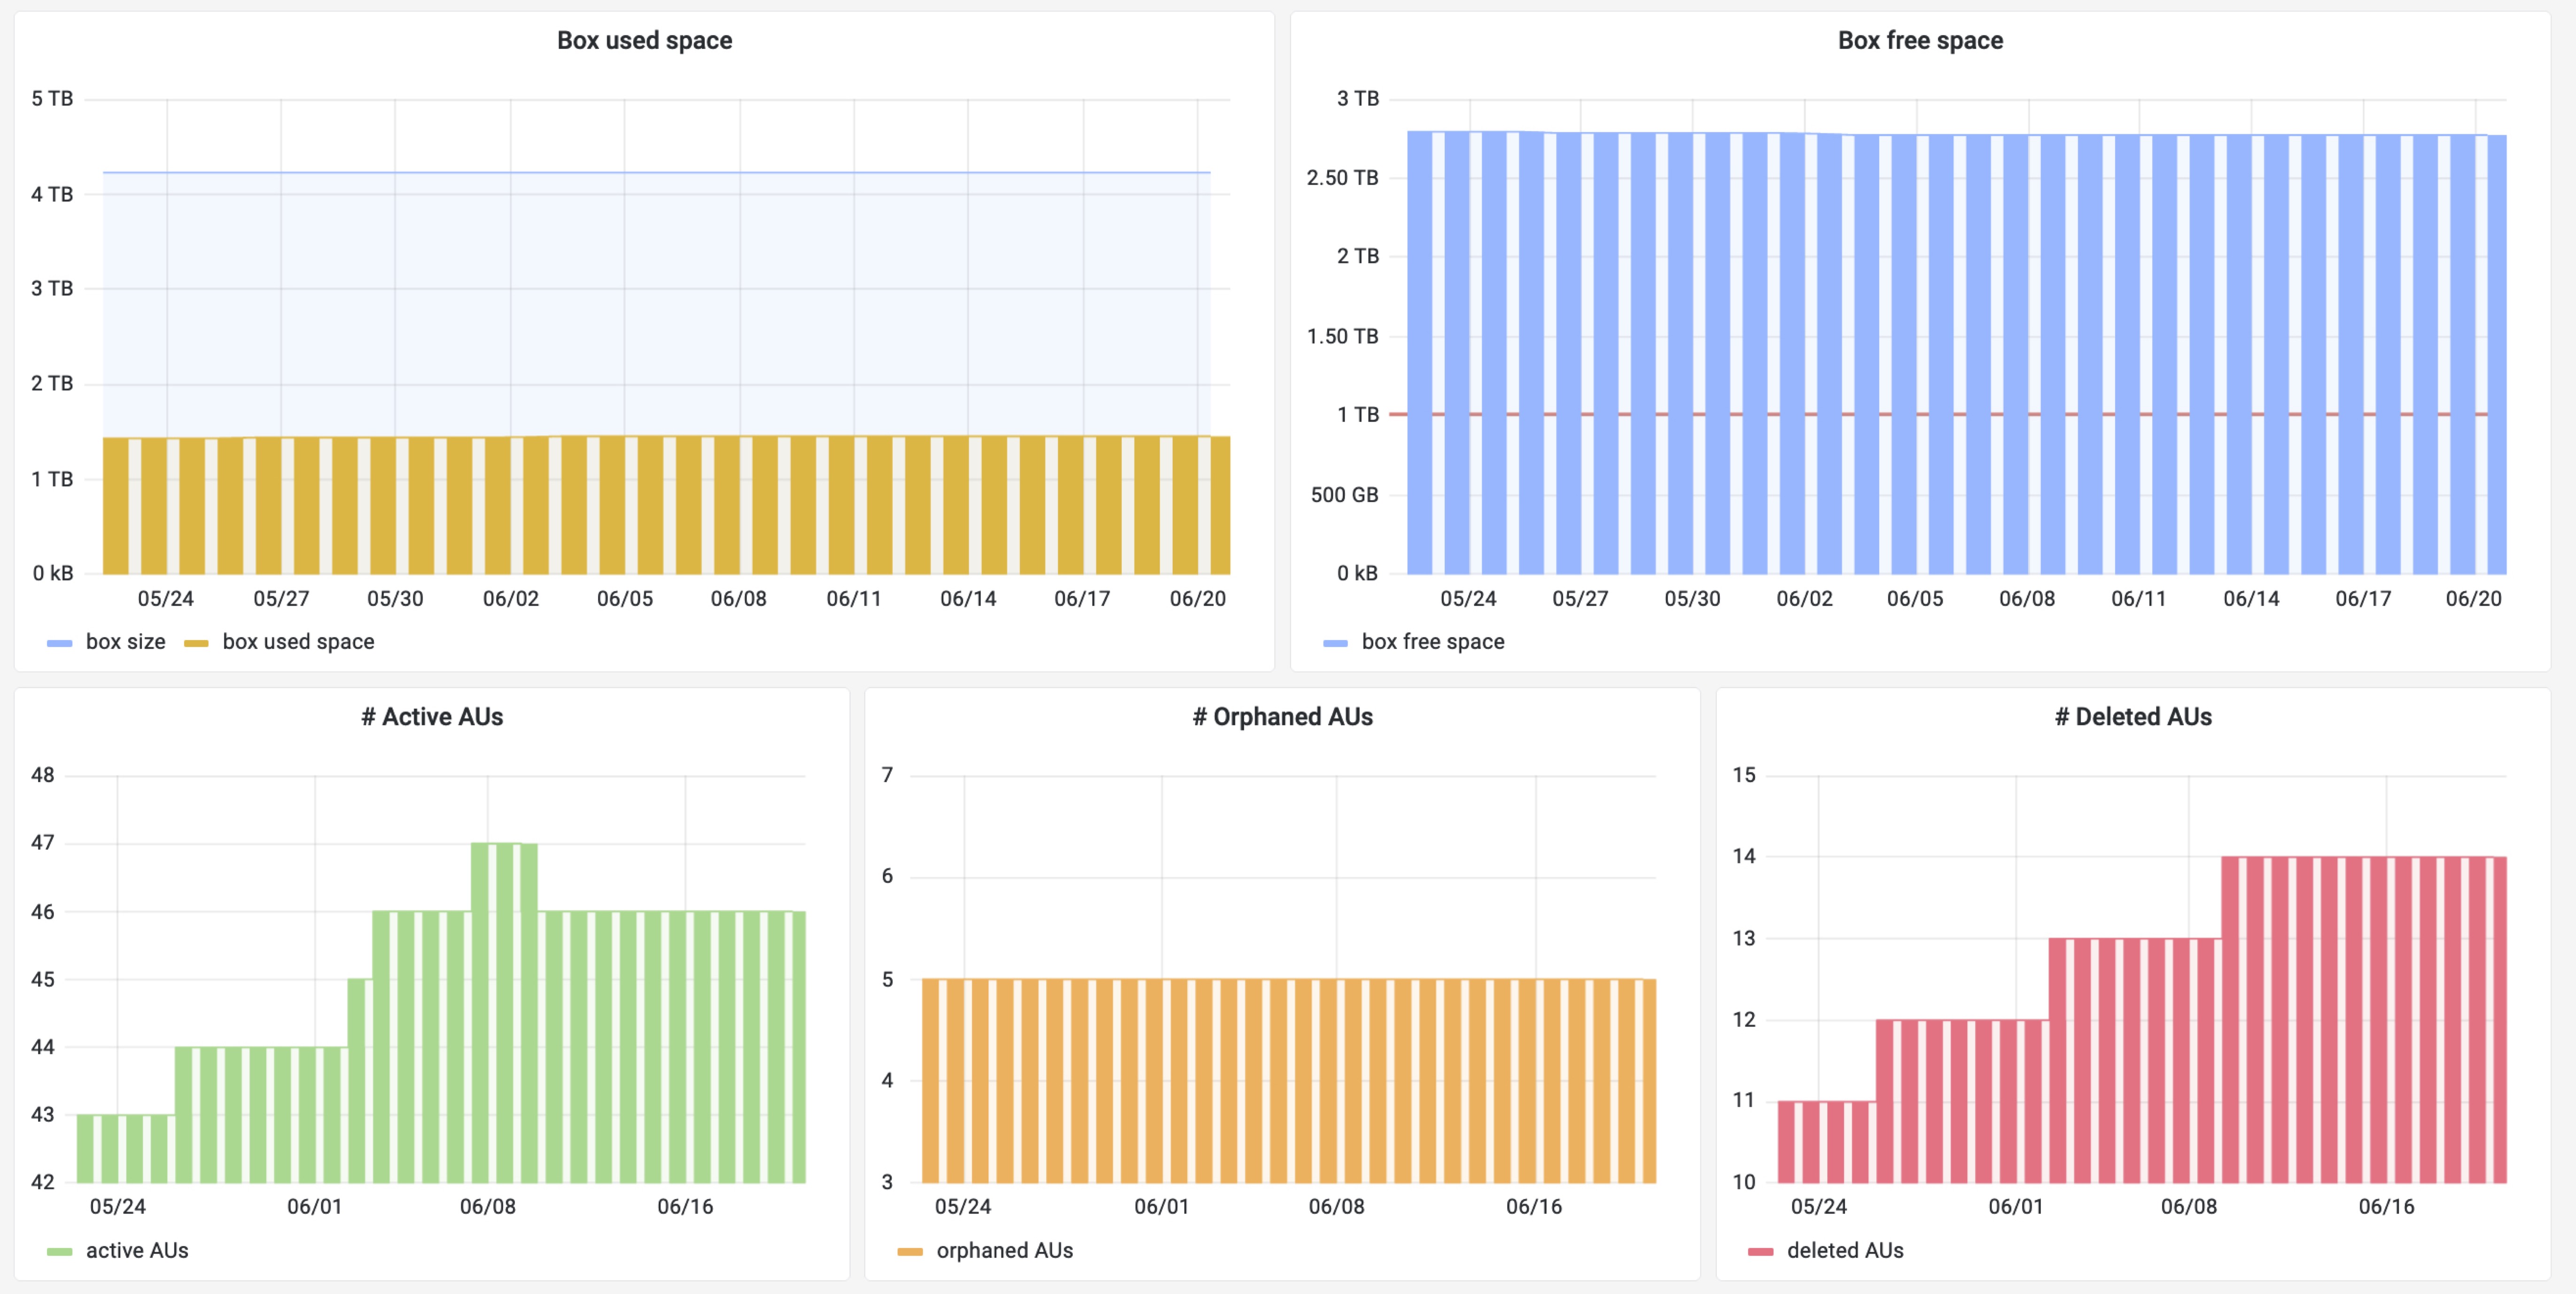
This dashboard provides details about box storage space and the number of AUs collected by the box:
It also provides information about the peers of the box in the network and combines all log files collected from the box in a single view: ![box_peers_and_log] box_peers_and_log.jpg
This is particularly helpful for debugging.
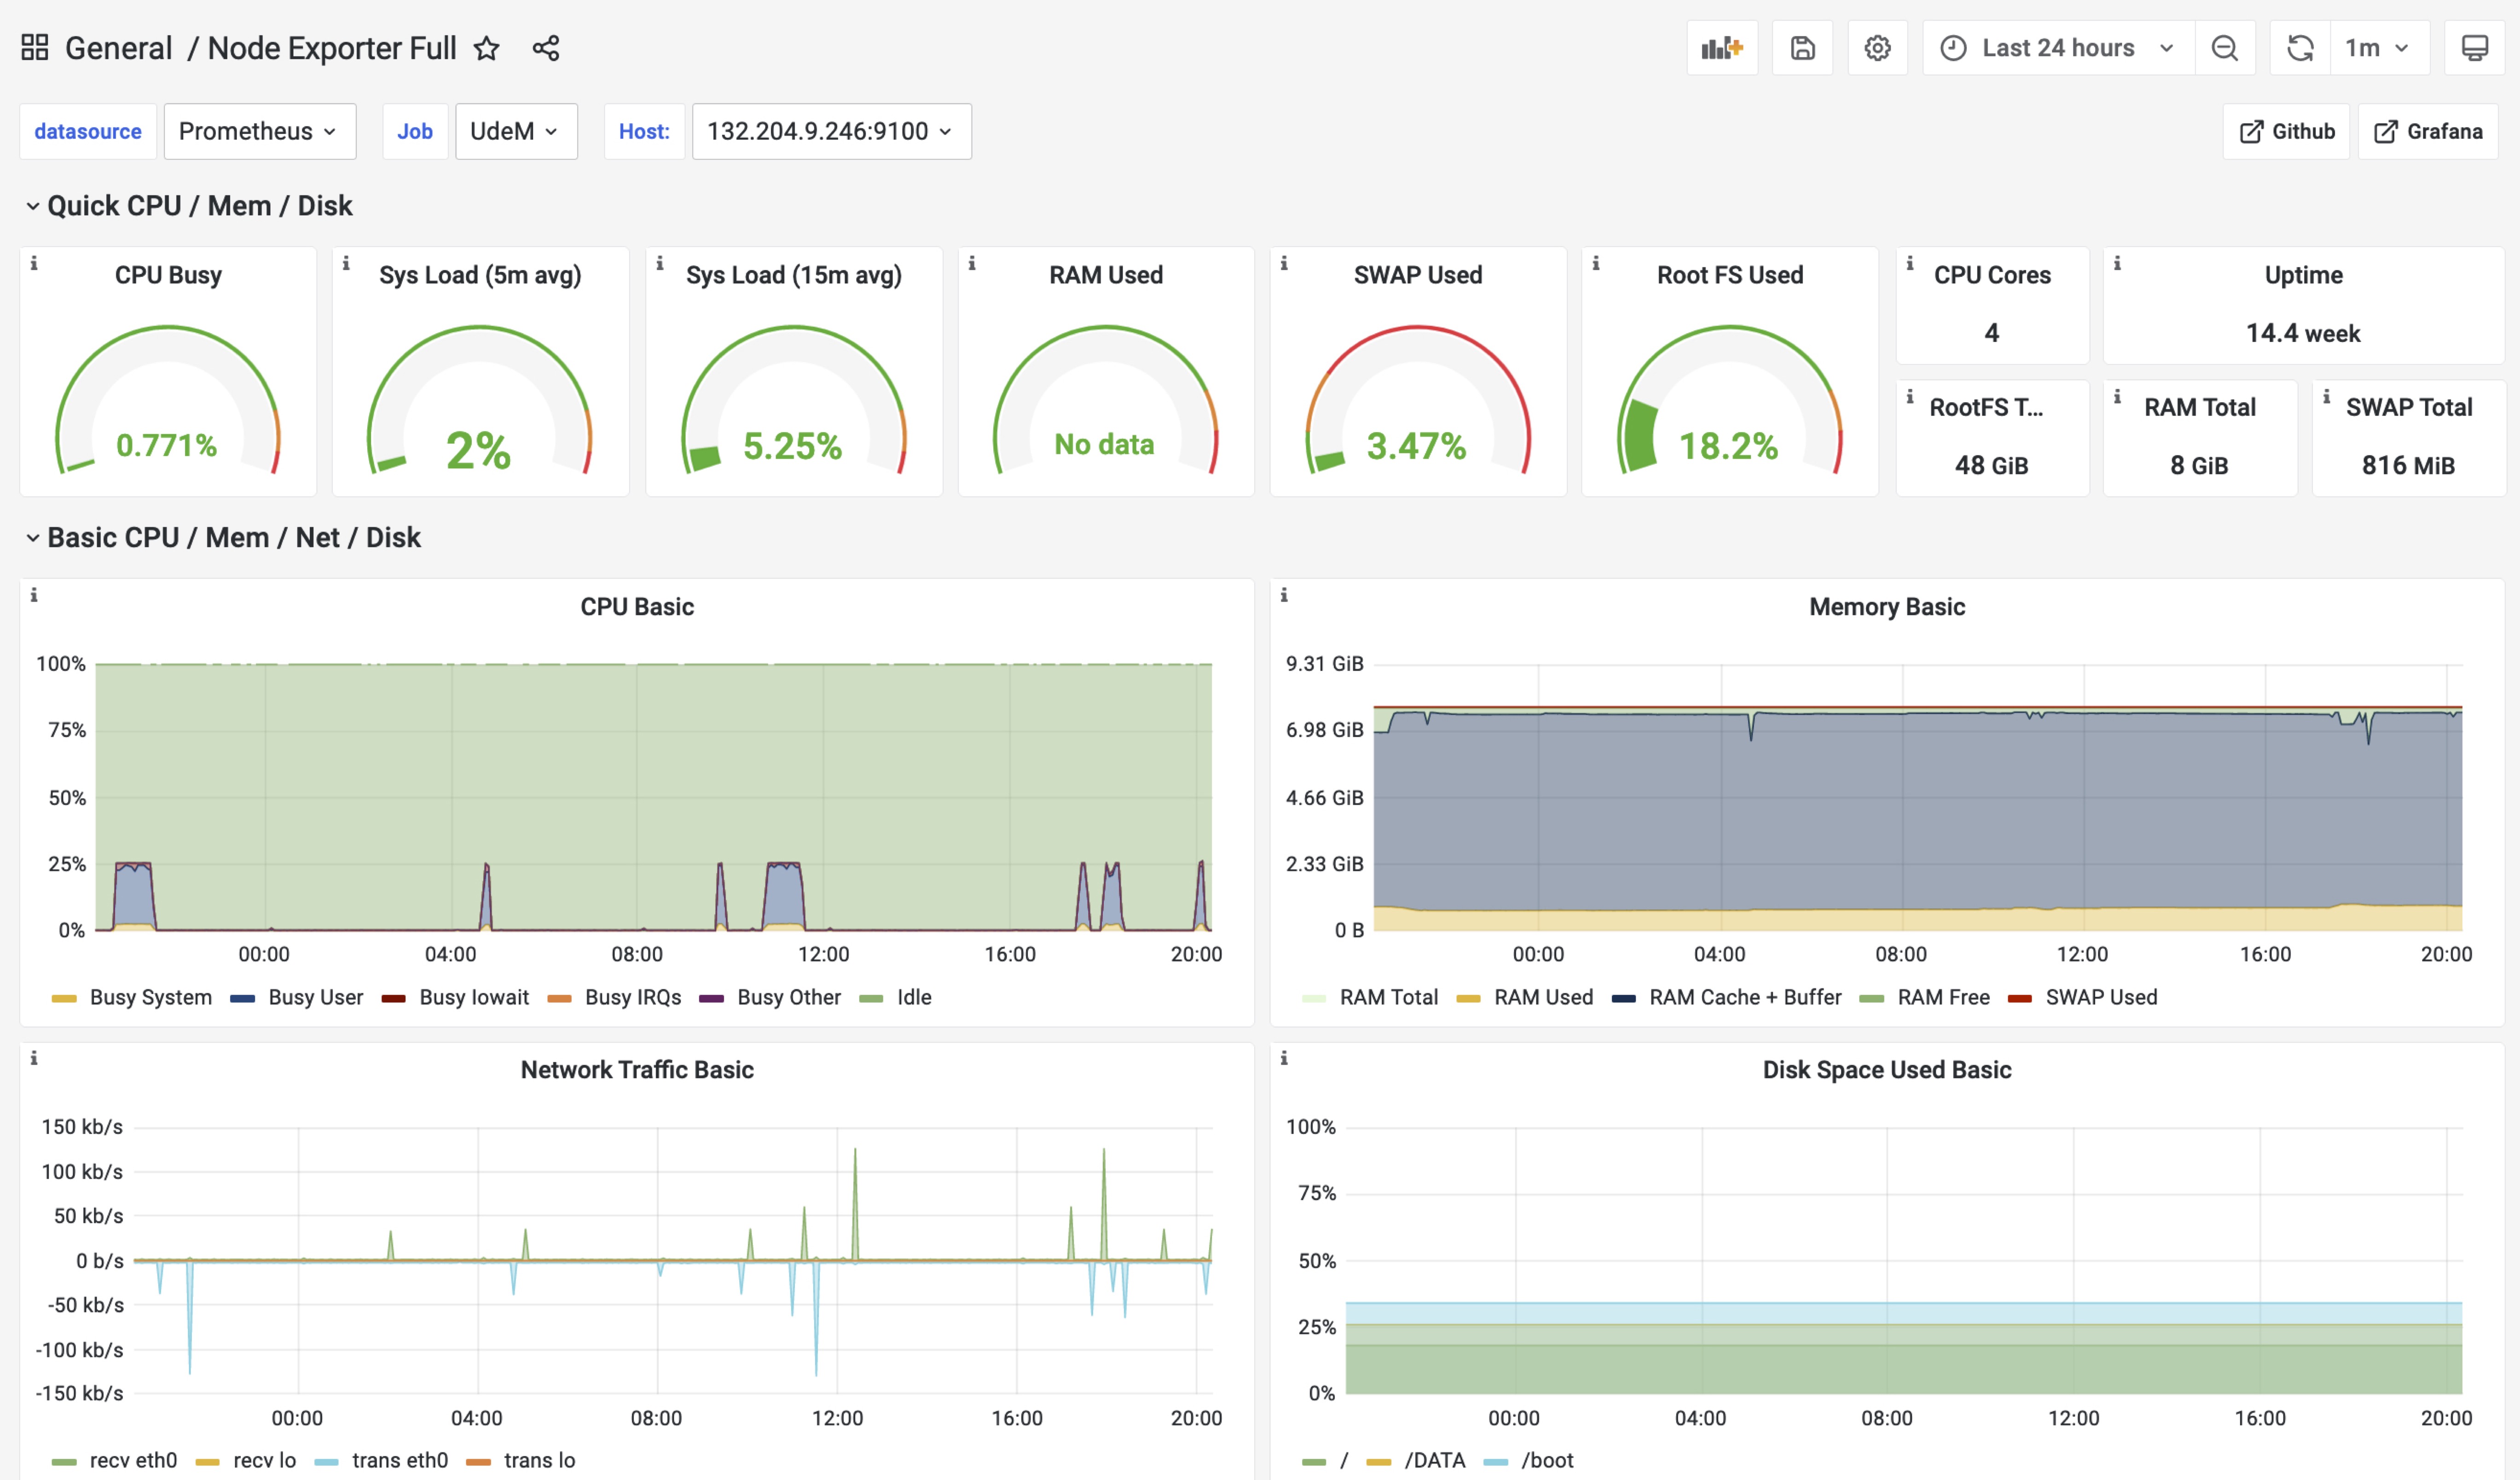
Finally, detailed LOCKSS box metrics (CPU, RAM, network usage...) are also made available from this dashboard:
A specific dashboard is generated for each publisher.
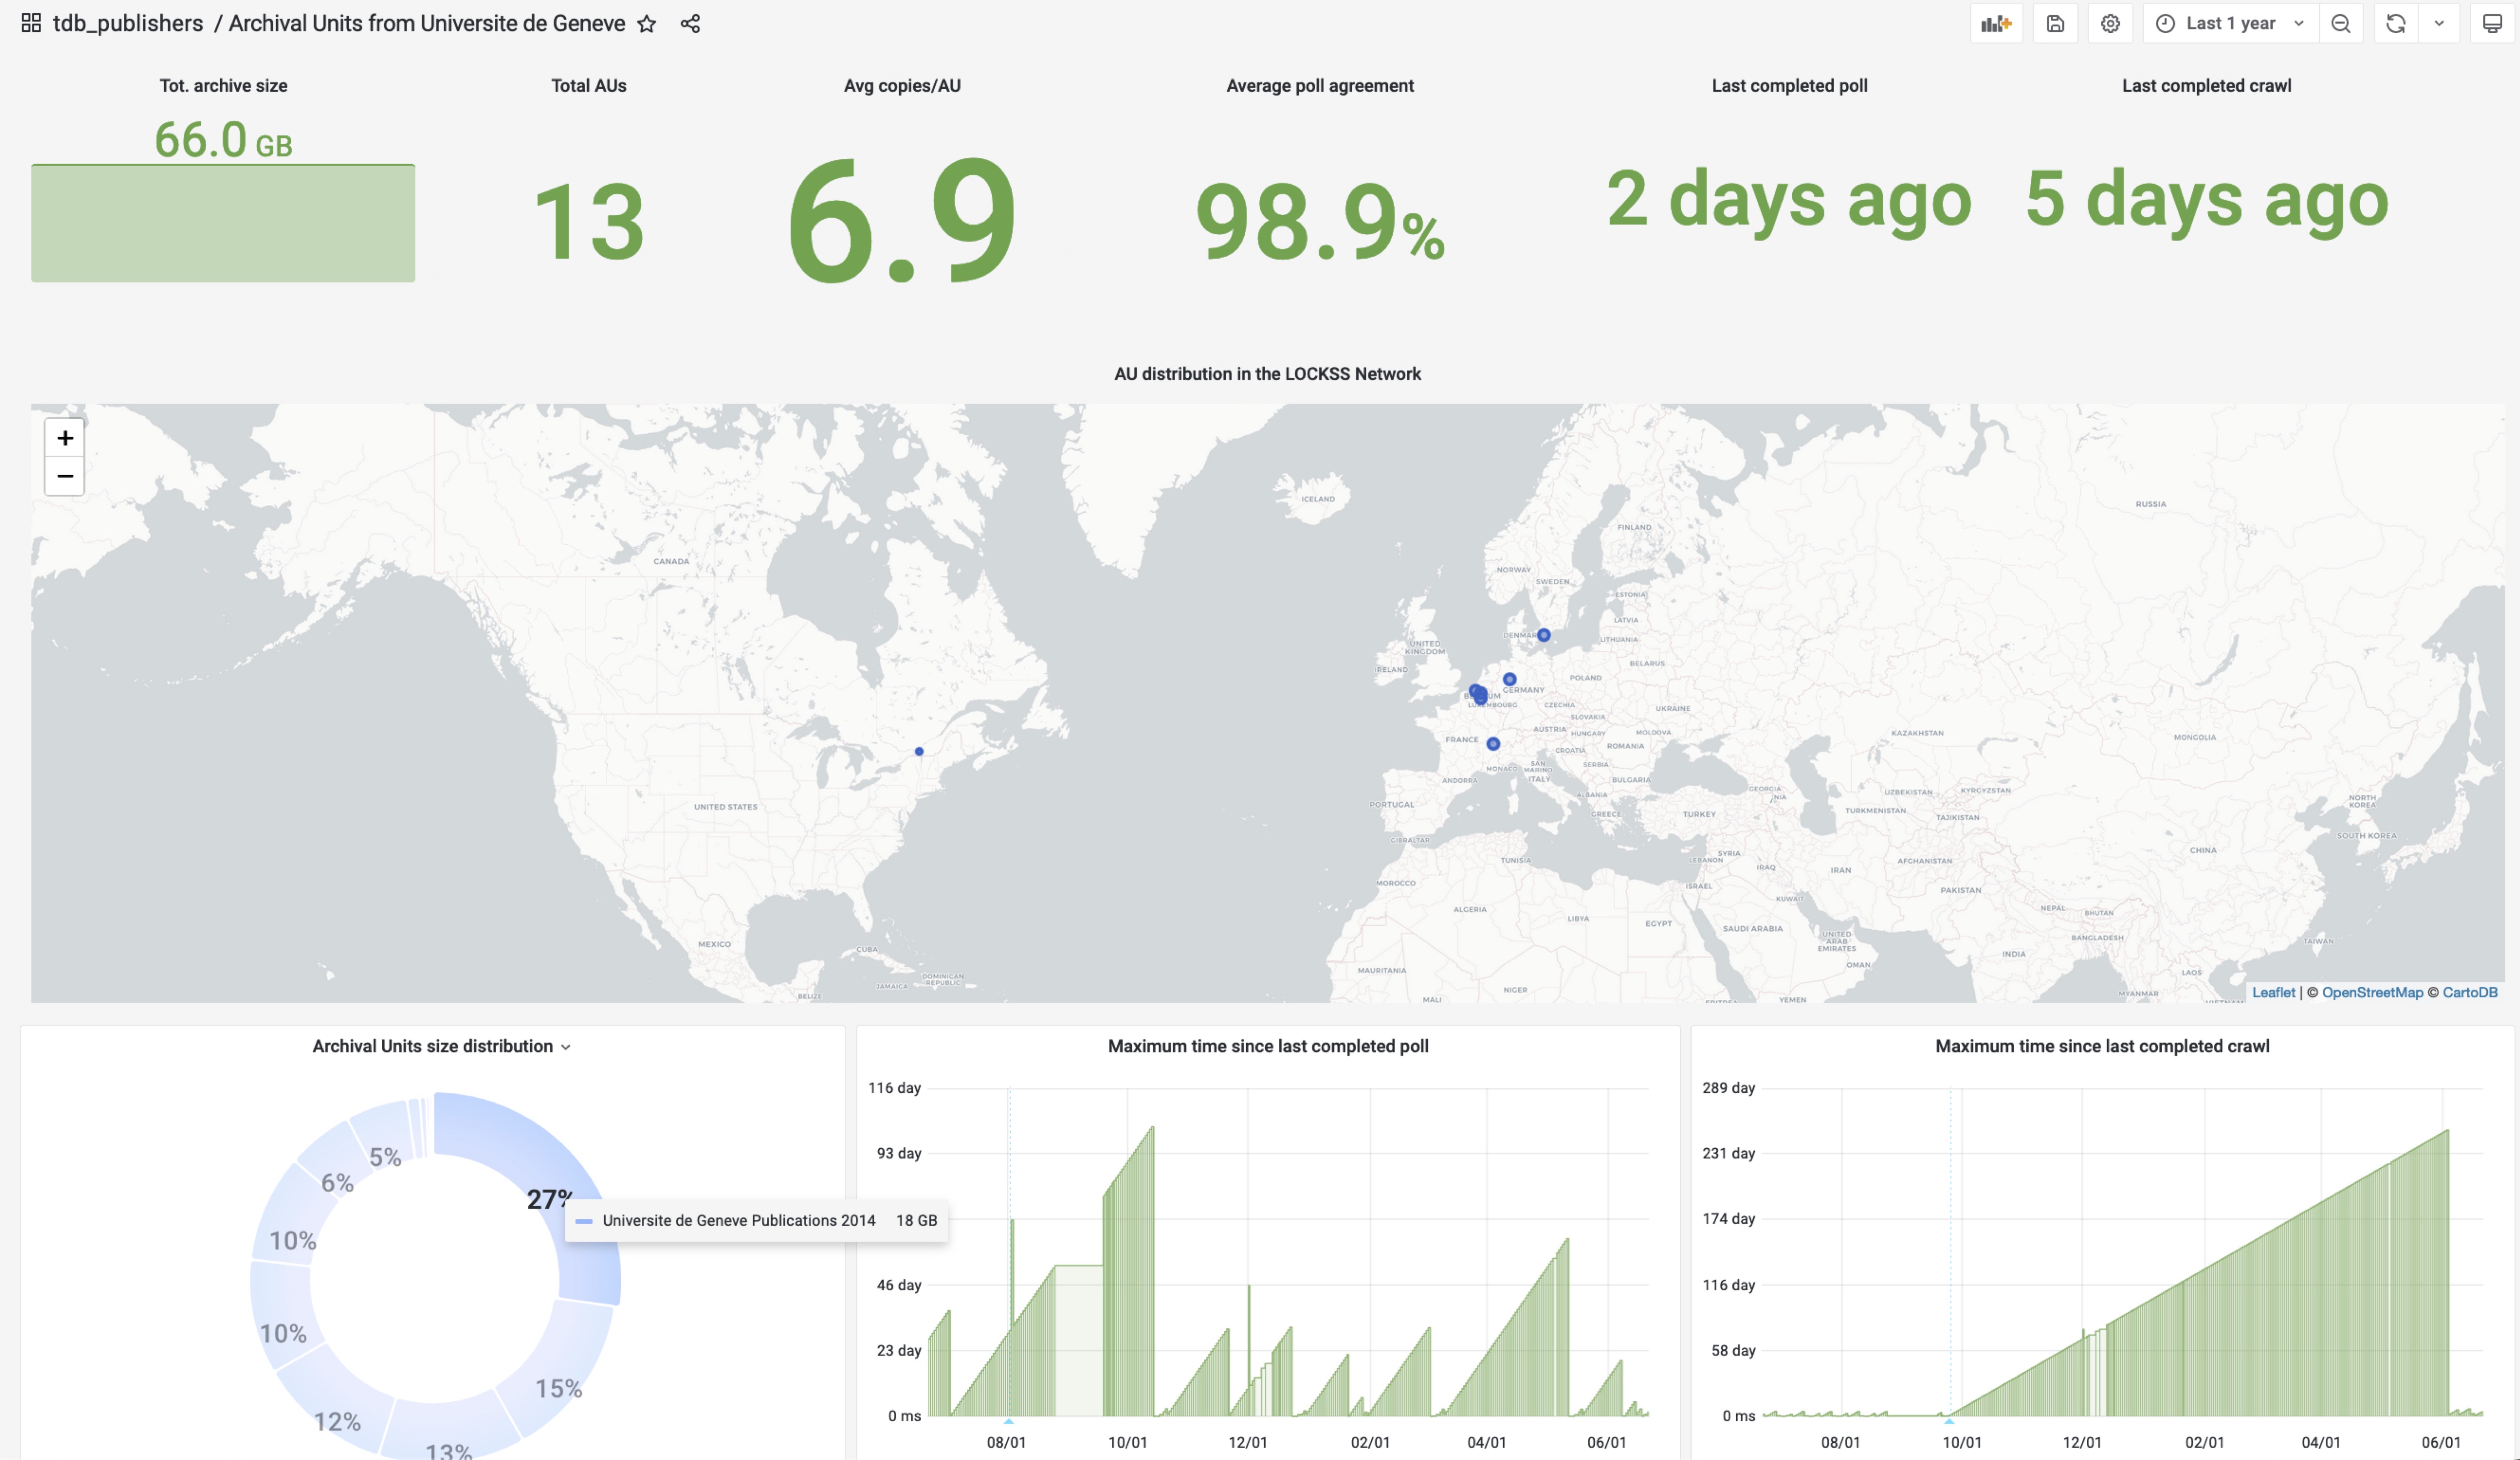
On this dashboard, one can track where the archives are preserved, the distribution of the archives per collection and other important metrics:
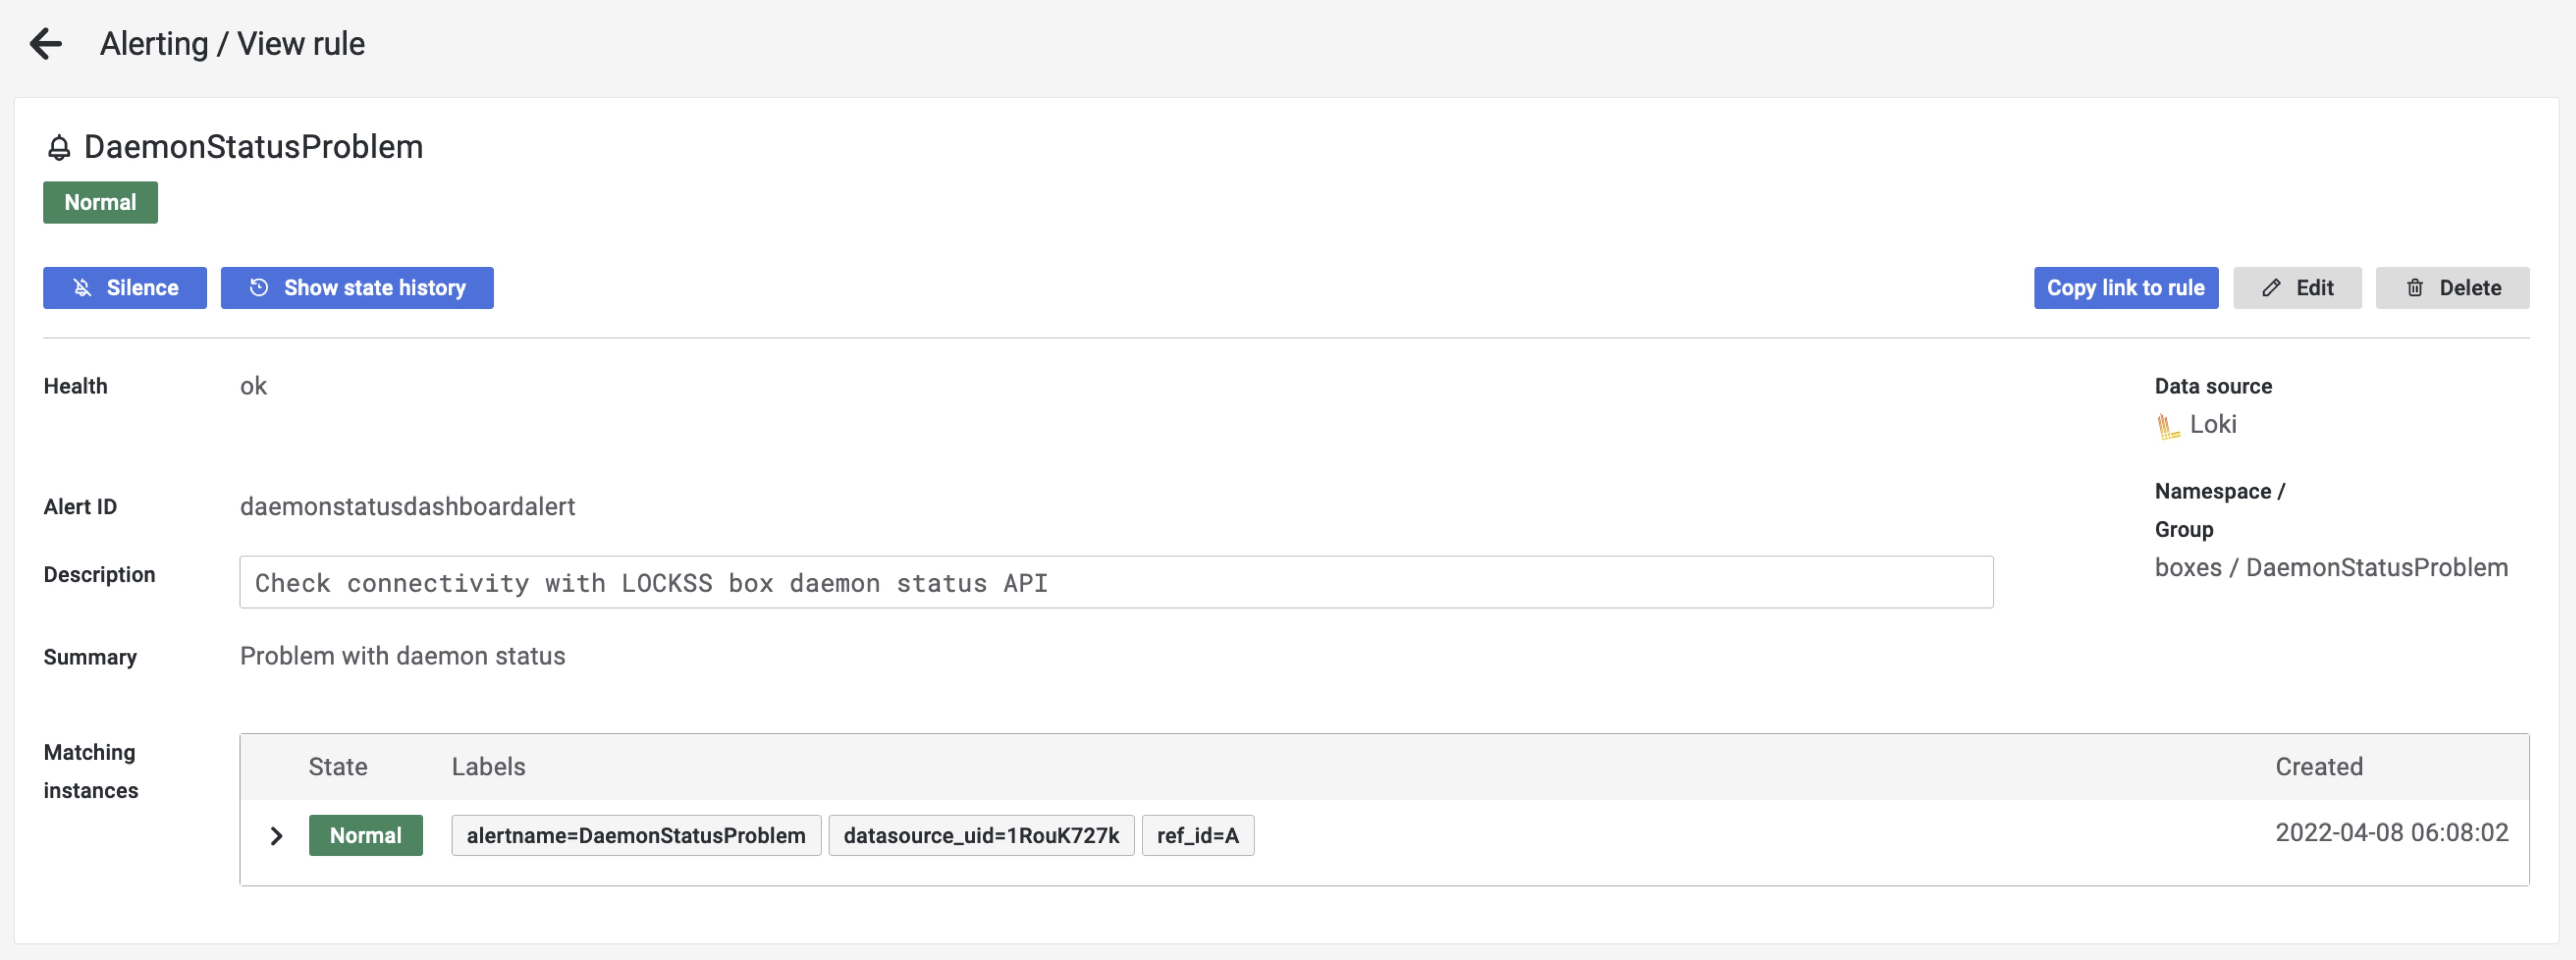
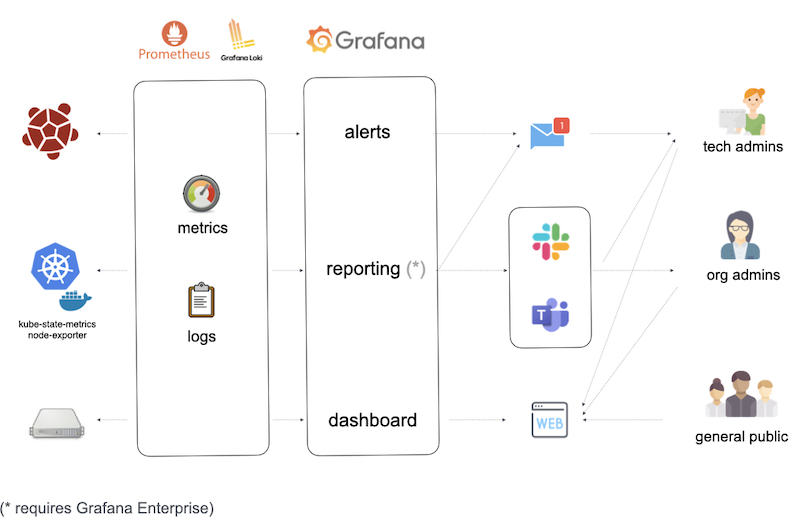
Custom alerts can be assigned to all dashboard components with specific triggers. An alert can be sent via various customizable channels (email, MS Teams, Slack, ...).
======= Note: a new web application based on Spring Boot and Angular will soon be released to replace the command-line configuration script used in this version.
First, you need to configure plnmonitor:
./config.sh
This script allows the administrator to:
- set the URL for their own LOCKSS network props server (lockss.xml)
- define the credentials to get status information for each box
- provide additional information for each box (geographical coordinates, institution, administrator,...)
Edit the docker-compose.yml file and replace "yourdomain.org" with your own server hostname on the following lines:
GF_SERVER_DOMAIN: yourdomain.org
GF_SERVER_ROOT_URL: https://yourdomain.org
- "traefik.http.routers.grafana.rule=Host(`yourdomain.org`)"
Edit your email address for Lets Encrypt certificate :
- "--certificatesresolvers.letsencrypt.acme.email=youremail@yourdomain.org"
Then, to bring up the dashboard, use:
./start.sh
The plnmonitor webapp is then available at the following URL: https://yourdomain.org/
On each box in your LOCKSS network, a user should be defined to get status information from the boxes.
For obvious safety reasons, a debug user should be specifically defined for this purpose. In order to do that:
- connect to the LOCKSS UI of your LOCKSS box as an administrator
- select User Accounts on the right side menu
- enter a Username (e.g. debug) and hit the "Create User" button
- enter a password and an email address
- tick only the "View debug info" checkbox
- hit the "Add User" button
Each LOCKSS box firewall should authorize access to the user interface (typically TCP input port 8081)) for the IP address of the machine running plnmonitor. This IP should also be authorized in the "Admin Access Control" menu of your LOCKSS box in the "Allow Access" list.
Loki is a log aggregation system integrated with the LOCKSS dashboard to collect the log files from all LOCKSS boxes in the ne twork in a centralized access point. Various log files are collected and consolidated to help users analyze and identify probl ems..
Promtail agents running on the boxes must be configured to collect the following files:
- /var/log/messages
- /var/log/lockss/stdout
- /var/log/lockss/daemon
The machine running the dashboard should authorize access to input port 3100/TCP for all LOCKSS boxes IP addresses in the netw ork.
Prometheus is an advanced monitoring and alert system integrated with the dashboard to collect metrics from all LOCKSS boxes i n the network. It provides in-depth observability of the software and infratructure stack.
Node exporter agents running on the boxes must be configured to collect the following metrics:
--collector.systemd
--collector.processes
LOCKSS boxes should authorize access to input port 9100/TCP for the machine running the dashboard.
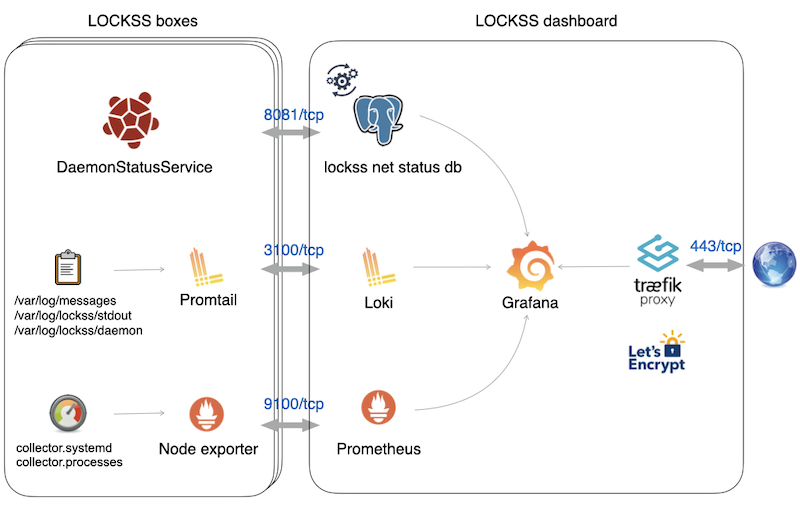
The schema below provides a description of the different components involved in the LOCKSS network dashboard.
The Grafana component aggregates data from different sources:
-
Status information from each LOCKSS boxes are collected in a Postgres database by the plnmonitor daemon with the DaemonStatusService SOAP API.
-
A Promtail agent runs on each LOCKSS box to collect relevant log files. A Loki Docker container running on the dashboard server collects the log files from all the agents running on the LOCKSS boxes.
-
A Node exporter agent runs on each LOCKSS box to collect relevant metrics. A Prometheus Docker container running on the dashboard server collects those metrics from all the agents runing on the LOCKSS boxes.
The access to Grafana from the Web is secured via a Traefik reverse proxy component handling HTTPs traffic and Let's Encrypt certificate generation.
In all Grafana dashboards, the user can set thresholds on relevant metrics to trigger alerts. Those alerts can be sent through a wide variety of channels. Dedicated status information that is relevant to technical administrators and for managers can thus be sent from the same tool.
While the Daemon Status web service is directly accessible with basic authentication, when SSL is switched on, the authenticat ion is done with a form-based login webpage and prevents using the web service. Given that the access control mechanism will b e considerably improved in LAAWS, it seemed more useful to focus on the other plnmonitor features.
