Backup Statistics
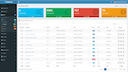
The IBAdmin has its own backup system statistics collector daemon: ibadstatd.py which independently collect all required statistics and store them in catalog database. You can display statistics data collected at IBAdmin->Statistics menu.

Available metrics:
| LP | Metric example | Unit | Description |
|---|---|---|---|
| 1 | bacula.client.debian.status | Status | Status of bacula-fd agent service at debian |
| 2 | bacula.client.number | Number | Number of bacula-fd clients |
| 3 | bacula.daemon.bacula-dir.status | Status | Status of bacula-dir service |
| 4 | bacula.daemon.bacula-fd.status | Status | Status of bacula-fd service |
| 5 | bacula.daemon.bacula-sd.status | Status | Status of bacula-sd service |
| 6 | bacula.jobs.all | Number | Number of all jobs |
| 7 | bacula.jobs.bytes | Bytes | Sum size of all jobs |
| 8 | bacula.jobs.errors | Number | Number of error jobs |
| 9 | bacula.jobs.files | Number | Number of all jobs files |
| 10 | bacula.jobs.queued | Number | Number of queued jobs |
| 11 | bacula.jobs.running | Number | Number of running jobs |
| 12 | bacula.jobs.warning | Number | Number of warning jobs |
| 13 | bacula.tapes.all | Number | Number of all defined tapes |
| 14 | bacula.tapes.available | Number | Number of available tapes |
| 15 | bacula.tapes.bytes | Bytes | Sum size of all tapes written |
| 16 | bacula.tapes.error | Number | Number of Error tapes |
| 17 | bacula.tapes.full | Number | Number of Full tapes |
| 18 | bacula.tapes.used | Number | Number of Used tapes |
| 19 | bacula.volumes.all | Number | Number of all defined volumes |
| 20 | bacula.volumes.available | Number | Number of all available volumes |
| 21 | bacula.volumes.bytes | Bytes | Sum size of all volumes written |
| 22 | bacula.volumes.error | Number | Number of Error volumes |
| 23 | bacula.volumes.full | Number | Number of Full volumes |
| 24 | bacula.volumes.used | Number | Number of Used volumes |
| 25 | catalog.files.size | Bytes | The size of the file table in catalog |
| 26 | catalog.log.size | Bytes | The size of the log table in catalog |
| 27 | catalog.size | Bytes | The size of the whole catalog database |
| 28 | catalog.stats.size | Bytes | The size of the stats table in catalog |
| 29 | system.cpu.loadavg.15m | Number | CPU load average in 15 min |
| 30 | system.cpu.loadavg.1m | Number | CPU load average in 1 min |
| 31 | system.cpu.loadavg.5m | Number | CPU load average in 5 min |
| 32 | system.cpu.util | Procent | CPU overall utilization |
| 33 | system.cpu.util.iowait | Percent | CPU utilization in I/O Wait |
| 34 | system.cpu.util.system | Procent | CPU utilization in System mode |
| 35 | system.cpu.util.user | Procent | CPU utilization in User mode |
| 36 | system.disk.centos-root.iops | Number/S | Disk dm-0 number of I/O requests per second |
| 37 | system.disk.centos-root.readps | Bytes/S | Disk dm-0 number of reads per second |
| 38 | system.disk.centos-root.writeps | Bytes/S | Disk dm-0 number of writes per second |
| 39 | system.fs./.inode.available | Number | Filesystem / available inodes for user |
| 40 | system.fs./.inode.free | Number | Filesystem / free inodes |
| 41 | system.fs./.inode.total | Number | Filesystem / number of inodes |
| 42 | system.fs./.size.available | Bytes | Filesystem / on device /dev/mapper/centos-root available space for user |
| 43 | system.fs./.size.free | Bytes | Filesystem / on device /dev/mapper/centos-root free space |
| 44 | system.fs./.size.total | Bytes | Filesystem / on device /dev/mapper/centos-root total size |
| 45 | system.mem.active | Bytes | The total amount of buffer or page cache memory that is in active use |
| 46 | system.mem.buffers | Bytes | The amount of physical RAM used for file buffers |
| 47 | system.mem.cached | Bytes | The amount of physical RAM used as cache memory |
| 48 | system.mem.dirty | Bytes | The total amount of memory waiting to be written back to the disk |
| 49 | system.mem.free | Bytes | The amount of physical RAM left unused by the system |
| 50 | system.mem.inactive | Bytes | The total amount of buffer or page cache memory that are free and available |
| 51 | system.mem.shmem | Bytes | The amount of physical RAM shared in processes |
| 52 | system.mem.total | Bytes | Total amount of physical RAM |
| 53 | system.mem.vm.total | Bytes | The total amount of memory of total allocated virtual address space |
| 54 | system.mem.vm.used | Bytes | The total amount of memory of used virtual address space |
| 55 | system.mem.used | Bytes | The total amount of memory used |
| 56 | system.mem.util | Procent | The total memory utilisation |
| 57 | system.net.eth0.rxps | Bytes/S | Network interface eth0 receive bytes per second |
| 58 | system.net.eth0.txps | Bytes/S | Disk eth0 number of reads per second |
| 59 | system.swap.cached | Bytes | The amount of swap, in kilobytes, used as cache memory |
| 60 | system.swap.free | Bytes | The total amount of swap free |
| 61 | system.swap.total | Bytes | The total amount of swap available |
You can tune statistics charts display with the following parameters:
- type of chart: line, bar, area
- chart time range
- chart with units, an unit multiplier, i.e. Bytes/kBytes/MBytes...
Chart time available ranges:
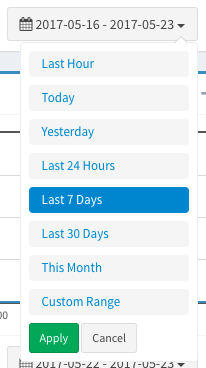
Every chart presents historic data only until "Live chart" option is applied. Then chart changes time range to the last hour and chart start updating every minute.
