Gallery
Michael Galloy, Peter Messmer, and Christine Roark; Tech-X Corporation.
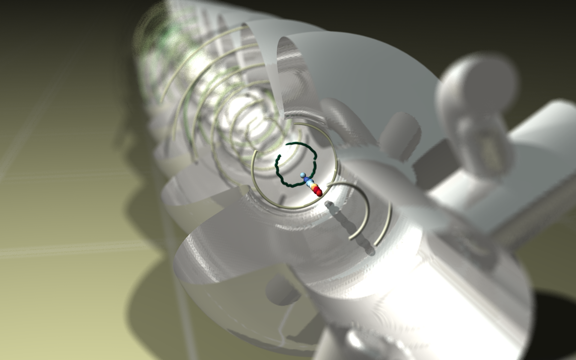
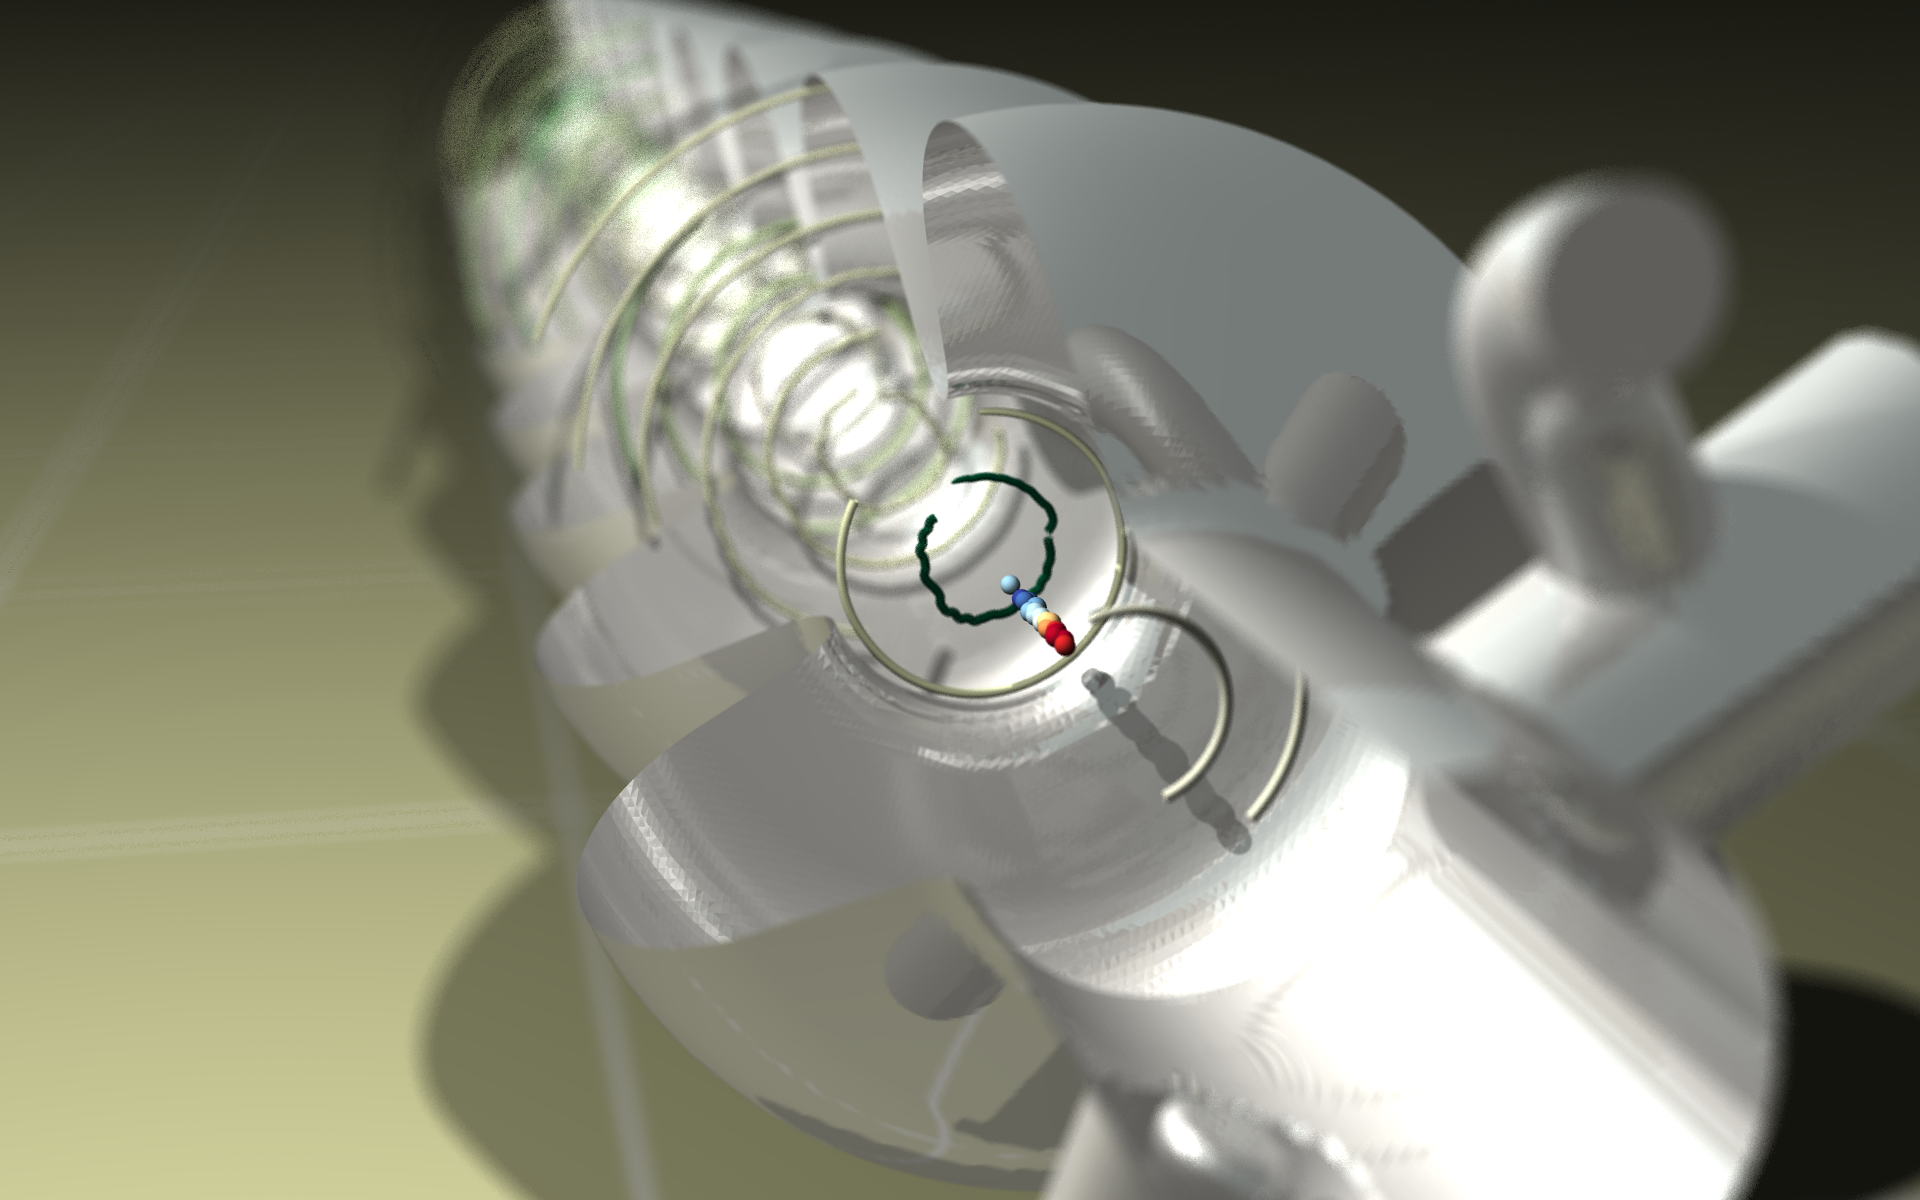
The current carried by electrons (colored spheres) traveling through these complex superconducting structures leads to the emission of an electromagnetic field. The thin wires trace the magnetic field structure, showing that divergence freeness of the magnetic field.
The entire process of creating this image was controlled from within IDL. File input/output and data processing was done completely with IDL. Rendering was done by creating an object graphics hierarchy and using a user-defined destination which rendered the scene by translating the object graphics hierarchy to POV-Ray files. This allows for interactive setup of a scene in IDL, but allowing the final rendering to be done in a slower, but more realistic ray-tracing application like POV-Ray.
Thanks also to David Smithe, Chet Nieter, John R. Cary, and the VORPAL team for original simulation setup.
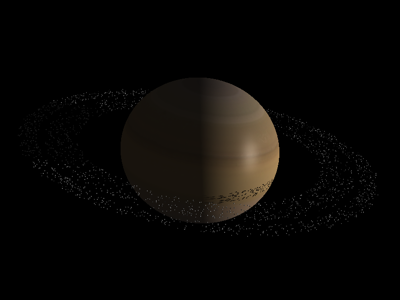
Simulation and visualization by Daniel Pomarede.
Simulation and visualization by Michal Dovciak using VIS_LIC
The animation shows the dependence of the observed direction of the polarization vector on inclination of the observer for a non-rotating black hole for scattered thermal emission.
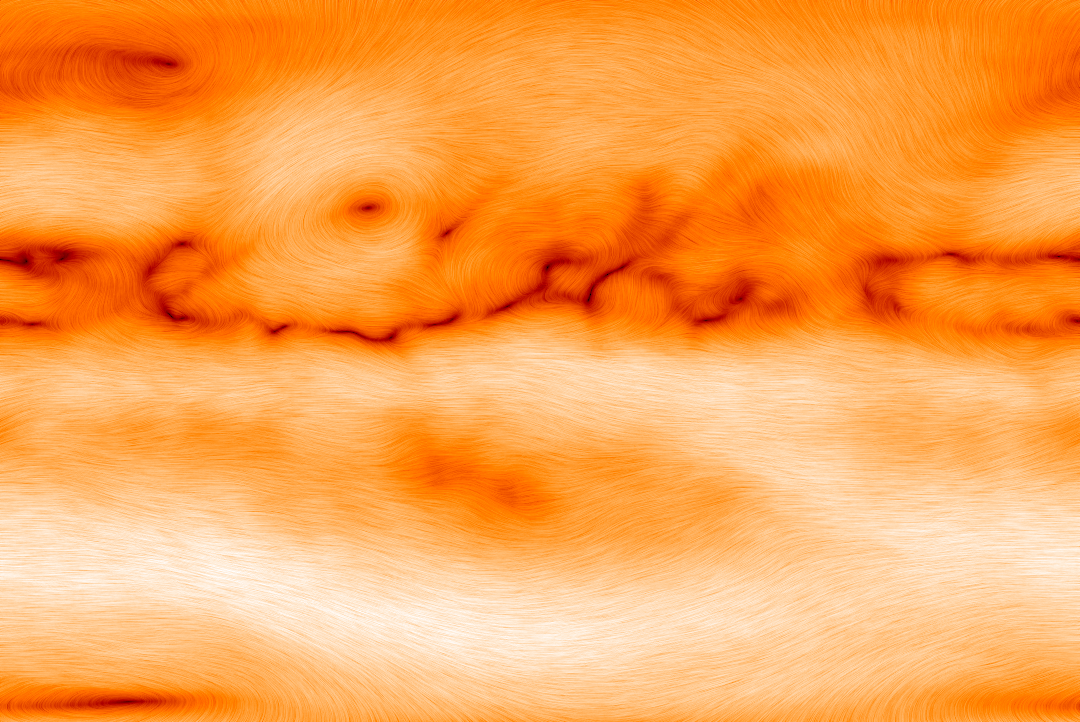
Visualization by Michael Galloy, Tech-X Corporation

These images show a line-integral convolution (LIC) representation of the global NASA wind velocity data. The first image shows the LIC output, while the second and third images combine the LIC output with the Earth image in the IDL distribution. The fourth image shows the combination texture mapped on a sphere representing the Earth's surface. Dark colors represent low velocity winds, lighter colors higher velocity winds. All aspects of the creation of the images were done in IDL. The code to compute the LIC was written in C and integrated with IDL using a DLM. The data access was done from NASA's DAP server using OPeNDAP's client IDL bindings (another DLM).